This topic contains a solution. Click here to go to the answer
|
|
|

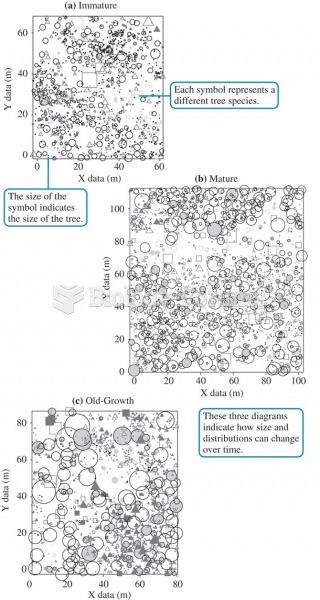 The spatial distribution of trees in three separate stands of different ages on Vancouver Island (da
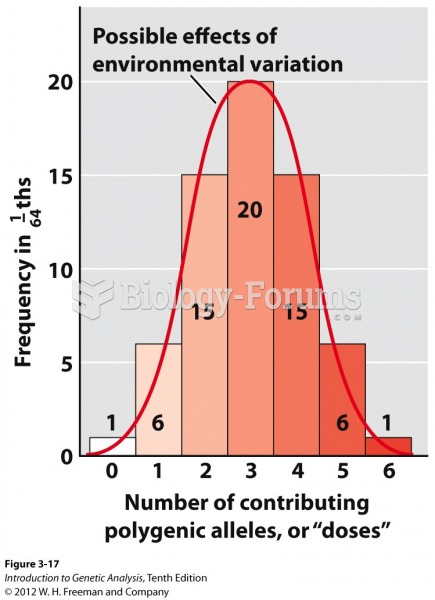 Histogram of polygenes from a trihybrid self
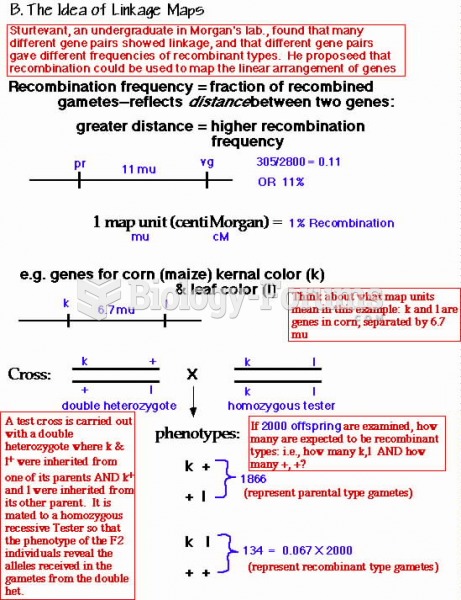 recombination frequency
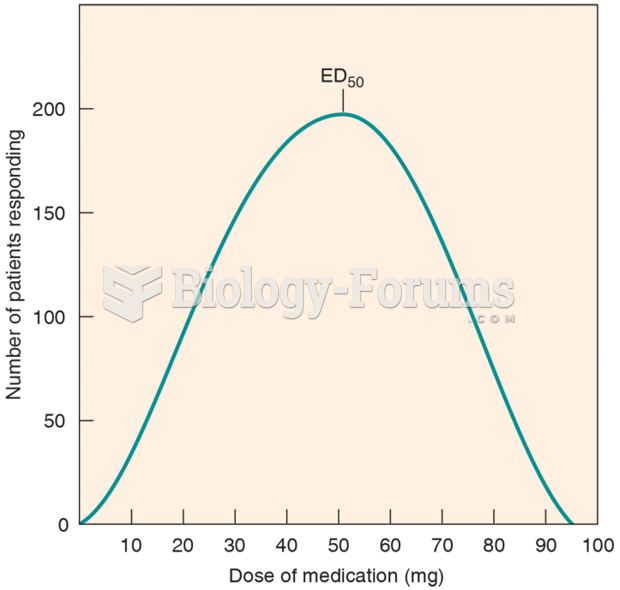 The Frequency Distribution Curve of a Drug
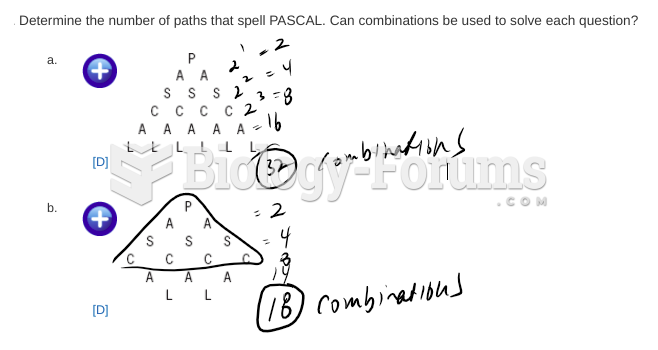 Data management questions
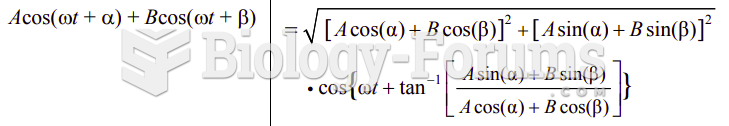 Adding different Angular frequency w(t)?