This topic contains a solution. Click here to go to the answer
|
|
|

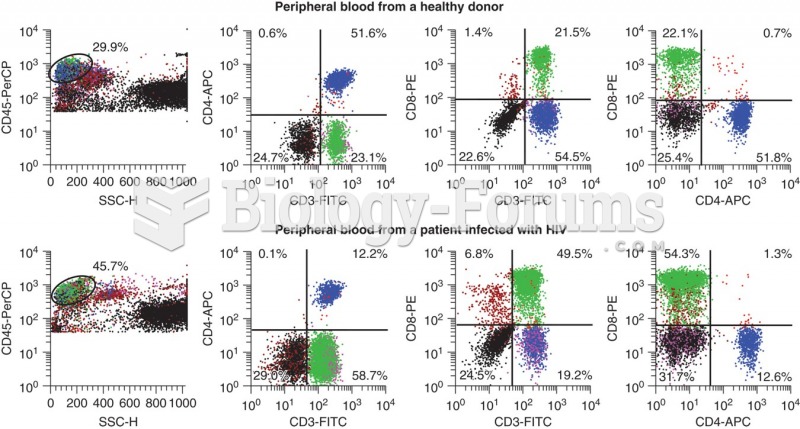 Flow data for a healthy donor (top panel) and a HIV positive patient. CD3 is a T-cell marker, CD4 is ...
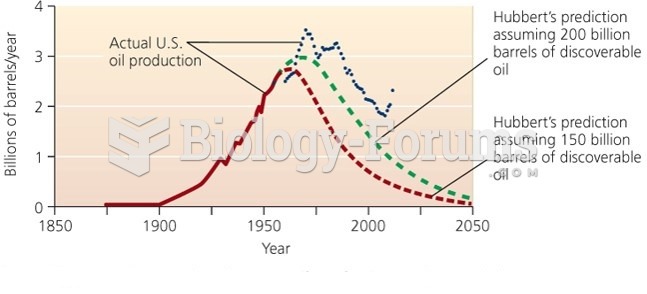 Hubbard’s Predication of Peak in U.S Oil Production with Actual Data
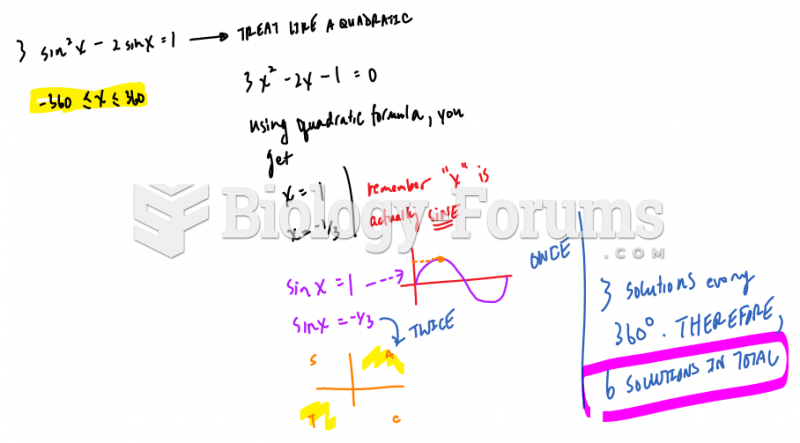 Solving graphically
 A(n) _____ is a spur-of-the-moment question. Fill in the blank(s) with correct word
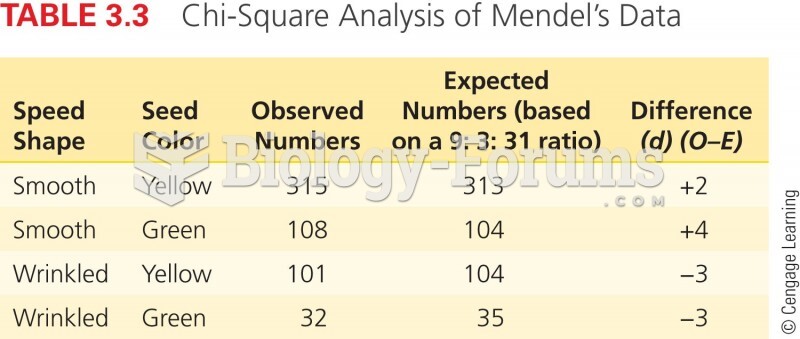 Chi-Square Analysis of Mendel's Data
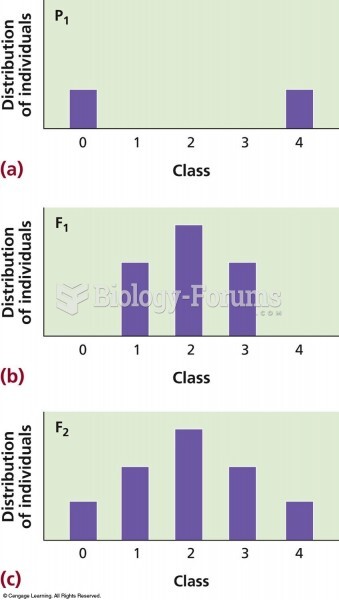 Frequency diagrams of skin colors. (a) Skin color distribution in the parents falls into two discont