This topic contains a solution. Click here to go to the answer
|
|
|

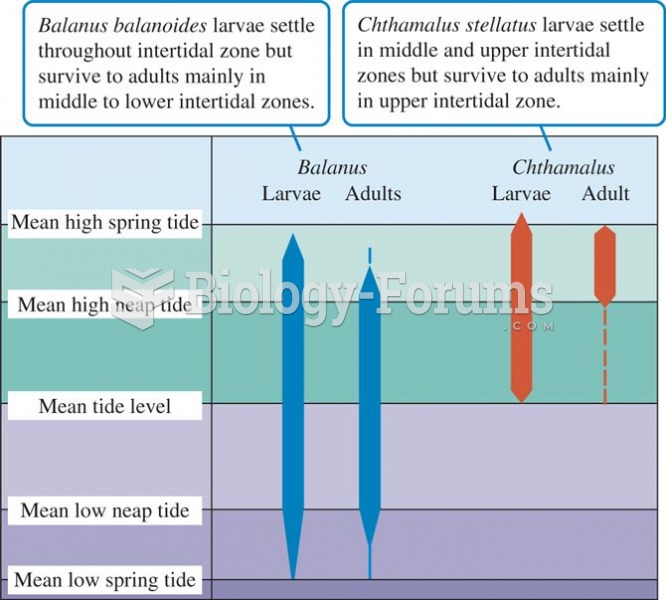 Distributions of two barnacle species within the intertidal zone
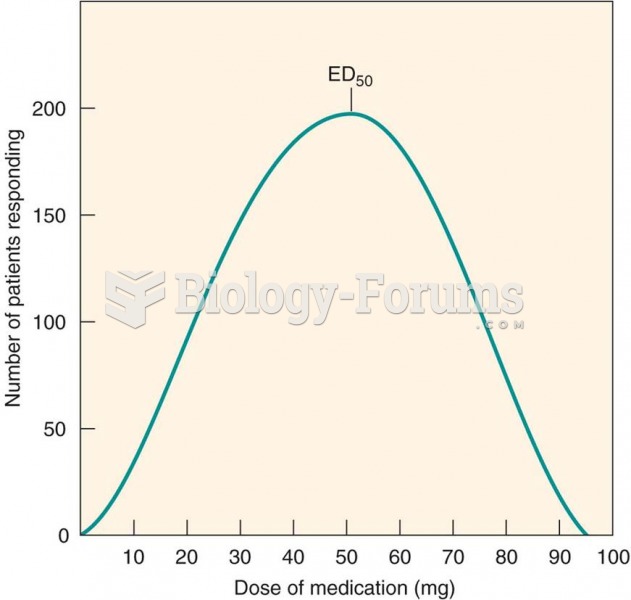 Frequency distribution curve: interpatient variability in drug response
 Double-label fluorescence microscopy can visualize the relative distributions of
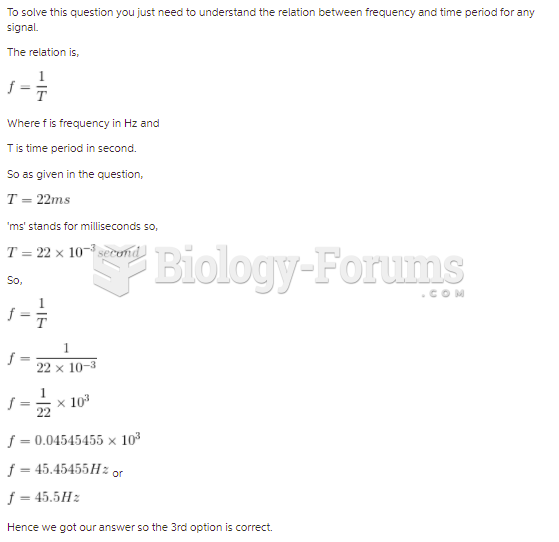 If the period of a square wave is 22 ms, what is its frequency?
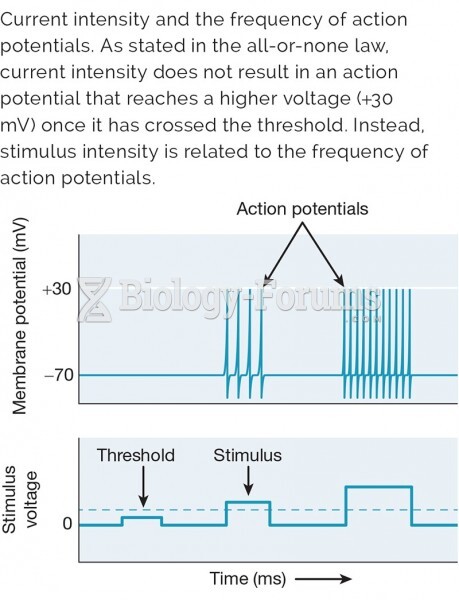 Current intensity and the frequency of action potentials
 The consequences of the intensity of natural selection on allele frequency.