Answer to Question 1Population density is the number of individuals per unit area (or volume). Rare individuals
have a much lower population density than dominant ones. (1) A random distribution implies
that the position of one organism in a community in no way influences the position of other
organisms in the same community. A truly random distribution indicates that conditions are
precisely the same throughout the habitat, an extremely unlikely situation, except possibly in
the unvarying benthic communities of abyssal plains. (2) The most common pattern for
distribution of organisms is small patchy aggregations, or clumps. Clumped distribution
occurs when conditions for growth are optimal in small areas because of physical protection
(in cracks in an intertidal rock), nutrient concentration (near a dead body on the bottom),
initial dispersal (near the position of a parent), or social interaction. (3) Uniform distribution, with equal space between individuals, such as the arrangement of trees planted in orchards, is
the rarest natural pattern of all. The distribution of some garden eels through their territories
becomes almost uniform because each eel can extend from its burrow just far enough to
hassle neighbor eels spaced equally distant.
Answer to Question 2Organisms newly introduced into a favorable environment with no competitors for food or
space will reproduce exponentially, tracing a J-shaped population growth curve. In nature,
very few populations reproduce at this maximal rate, however, because environmental
conditions are rarely ideal and because limiting factors in the environment quickly slow the
rate of population growth. The sum of the effects of these limiting factors in the environment
is called environmental resistance. Environmental resistance causes the actual population
growth curve to be lower than the maximum potential growth curve. When limiting factors
intrude, the growth curve is S-shaped; it gradually flattens toward an upper limit of the
number of individuals in the population. The final number of organisms oscillates around the
carrying capacity of the environment for that species, which is the population size of each
species that a community can support indefinitely under a stable set of environmental
conditions.

 During their annual migration, the entire population of Arctic terns move from the Arctic Ocean in t
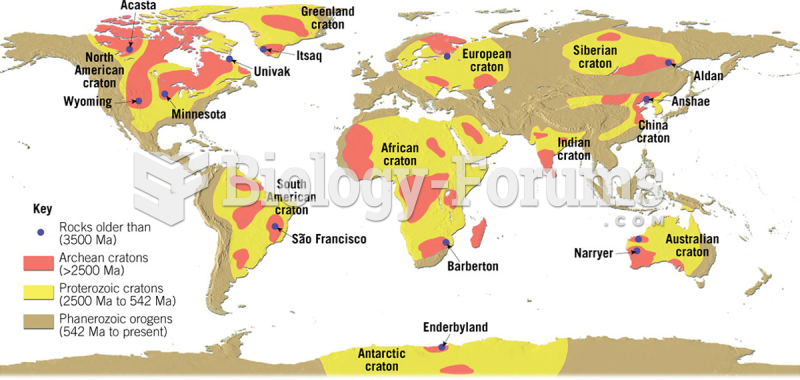 Distribution of Crust Remaining from Archean and Proterozoic
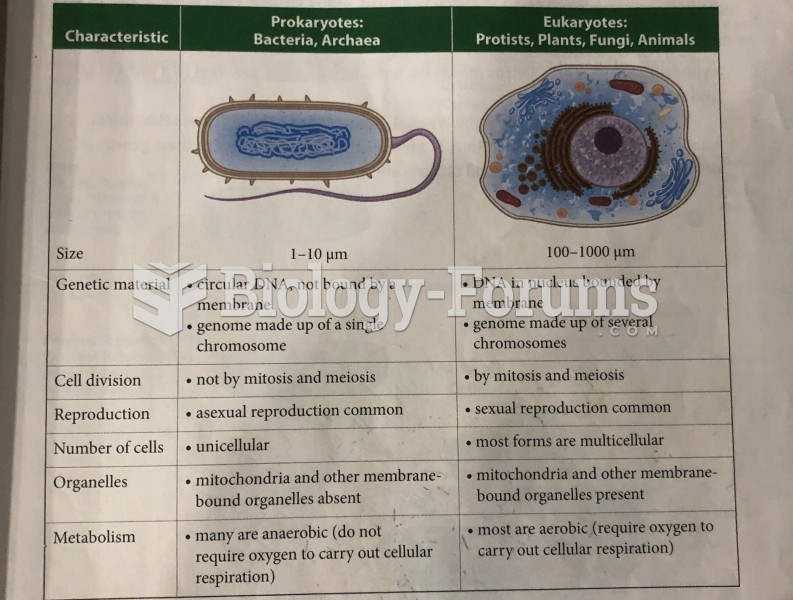 Two Types of Cells
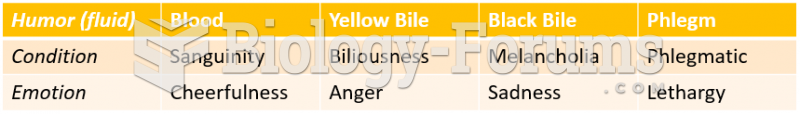 Humor (Fluid Types)
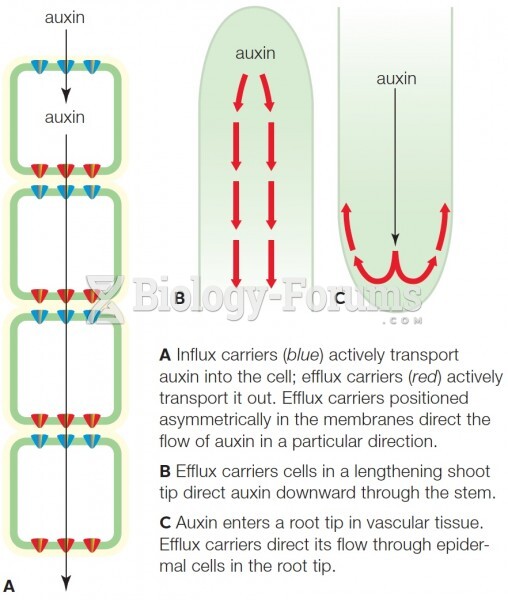 Polar distribution of auxin is driven by asymmetrical positioning of plasma membrane active transpor
 Codominance in ABO Blood Types