This topic contains a solution. Click here to go to the answer
|
|
|

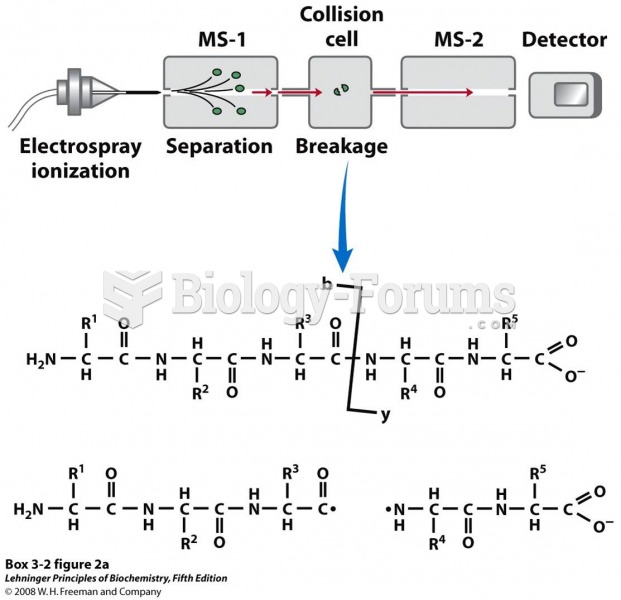 Obtaining protein sequence information with tandem MS
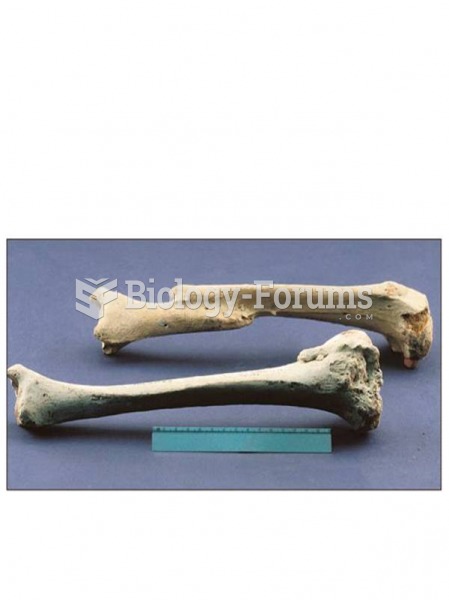 Healed bone fractures can provide clues about activities and fresh fractures can yield information a
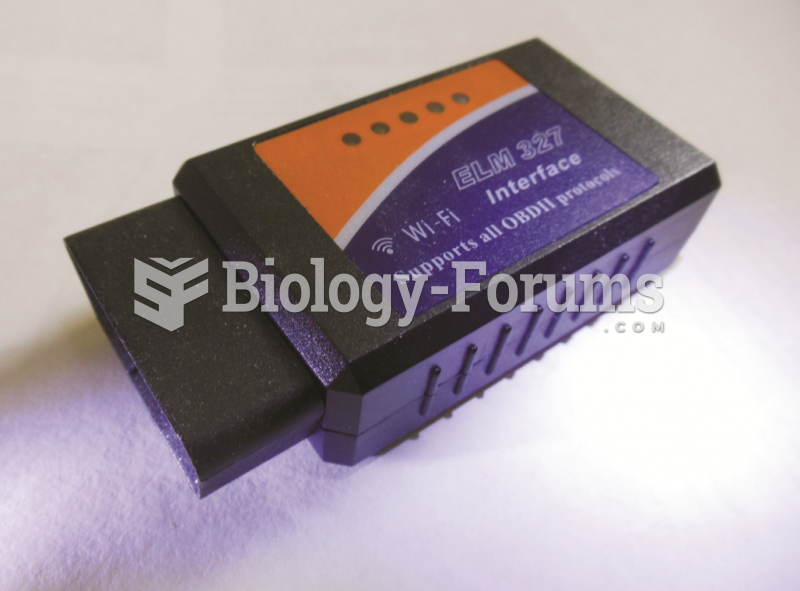 A Bluetooth adapter that plugs into the DLC and transmits global OBD II information to a smart phone ...
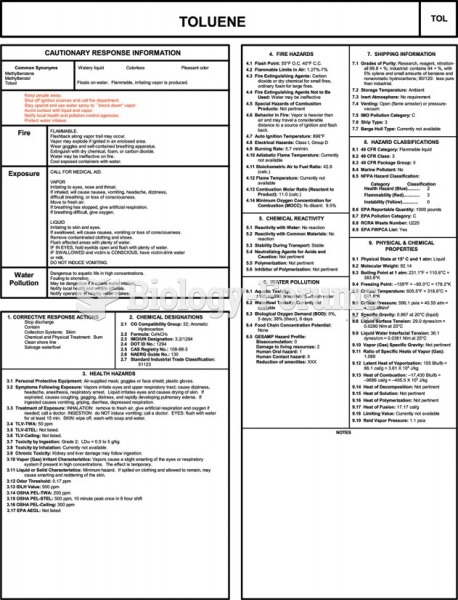 The CHRIS manual entry for toluene. Useful information includes response information, chemical and ...
 economic question
 home work question