|
|
|

 John Lindley
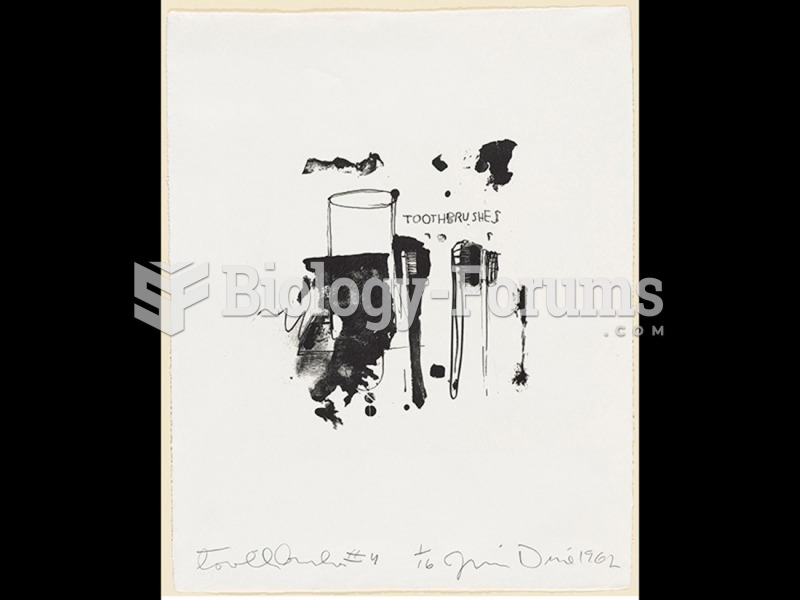 Jim Dine, Toothbrushes #4.
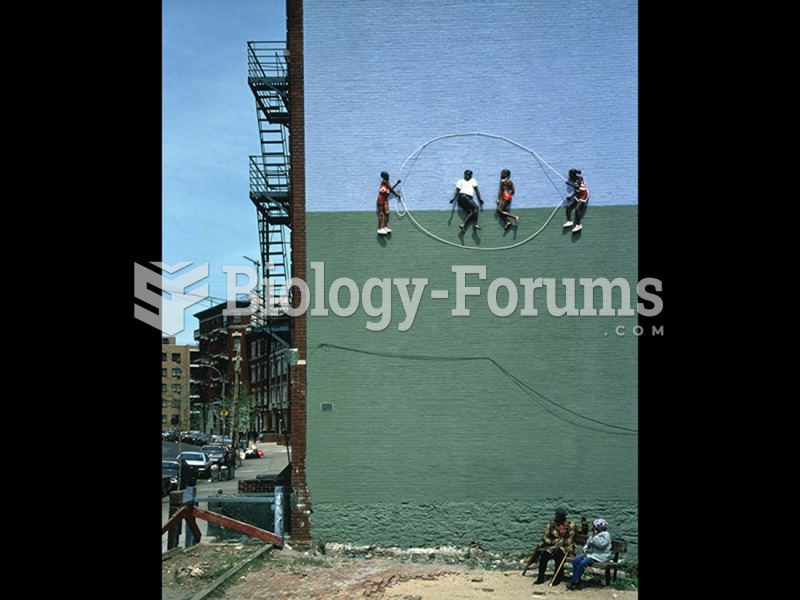 John Ahearn, Homage to the People of the South Bronx: Double Dutch at Kelly Street 1: Frieda, ...
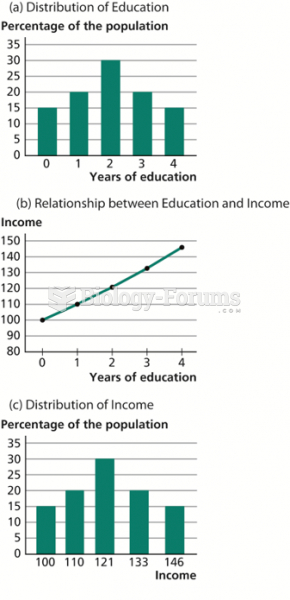 Determination of Income Inequality
 Income per Capita versus Total Fertility Rate