This topic contains a solution. Click here to go to the answer
|
|
|

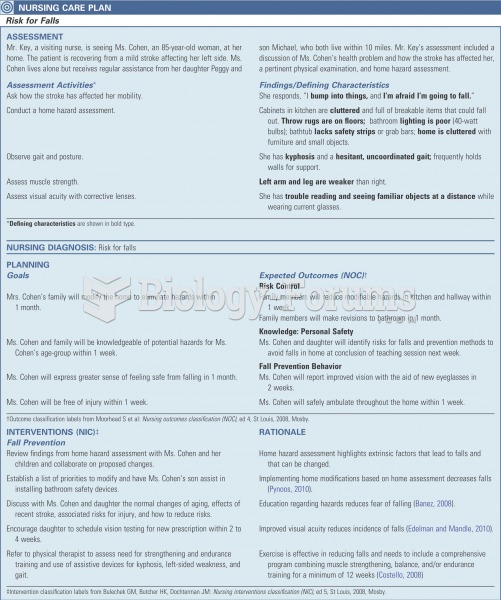 Risk for falls
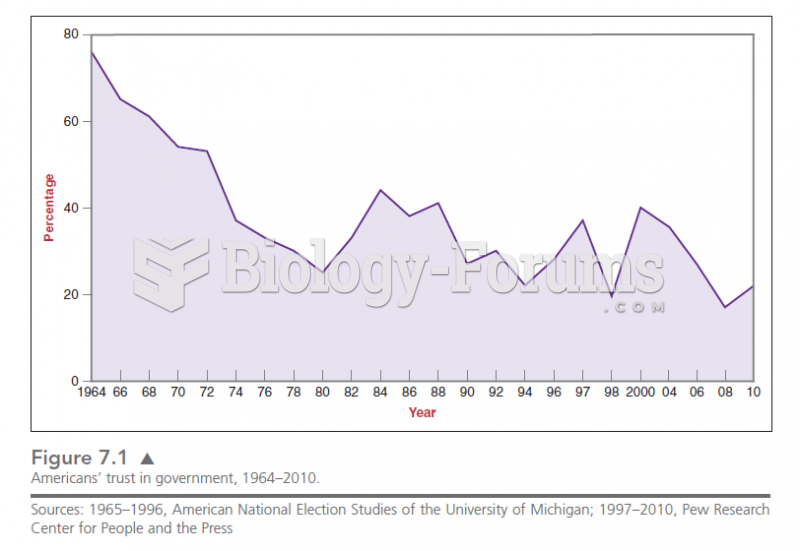 Figure 7.1 shows the rapid decline in the trust of Americans in government since the 1960s. This de
 Monopoly, patented in 1935, was an instant best-seller: Players risk all their assets in an attempt
 Risk factors for suicide.
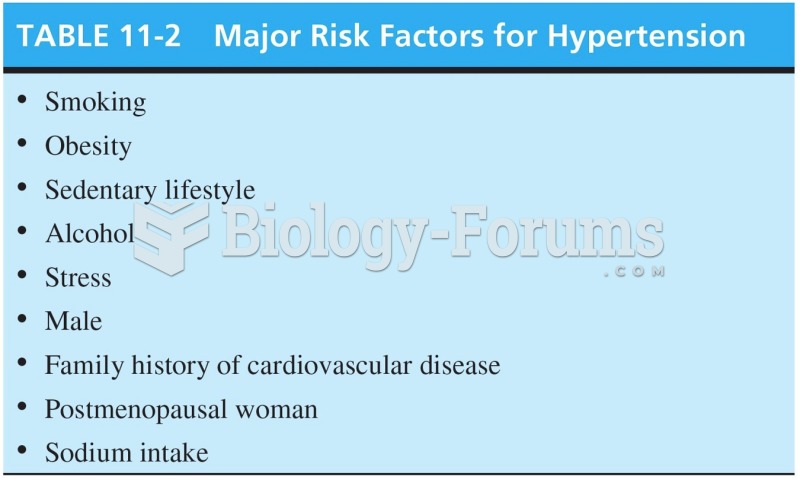 Major Risk Factors for Hypertension
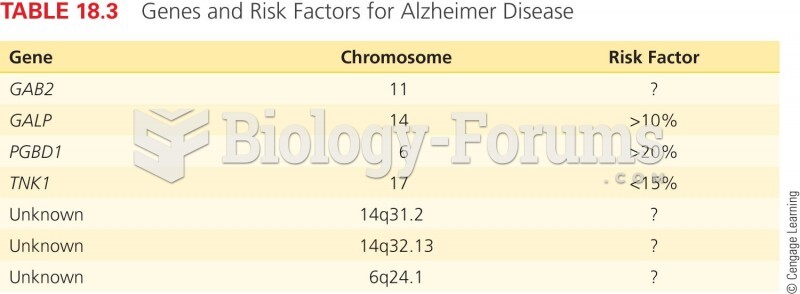 Genes and Risk Factors for Alzheimer Disease