This topic contains a solution. Click here to go to the answer
|
|
|

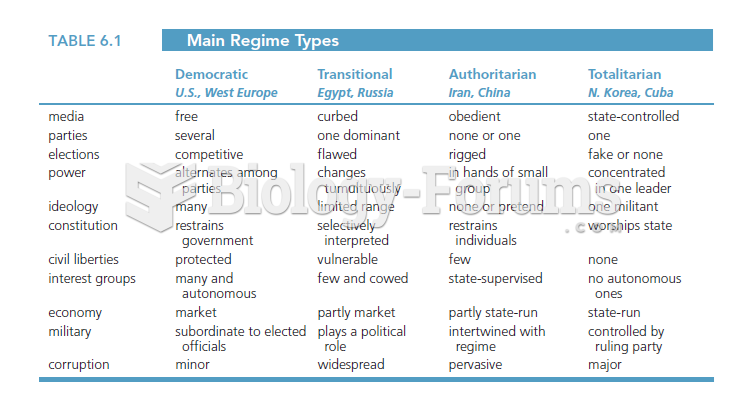 Table 6.1 illustrates the main regime types and their differences. It breaks the regimes into four
 Question
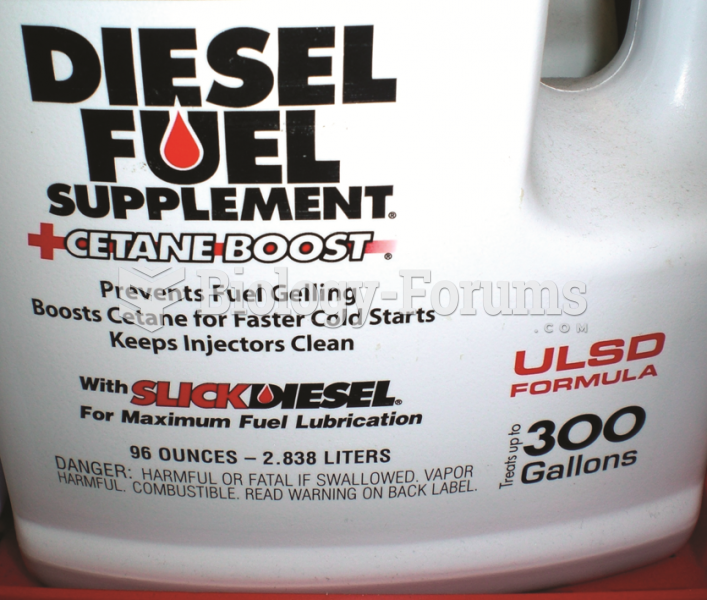 Many diesel fuel additives increase the cetane rating which results in improved fuel economy.
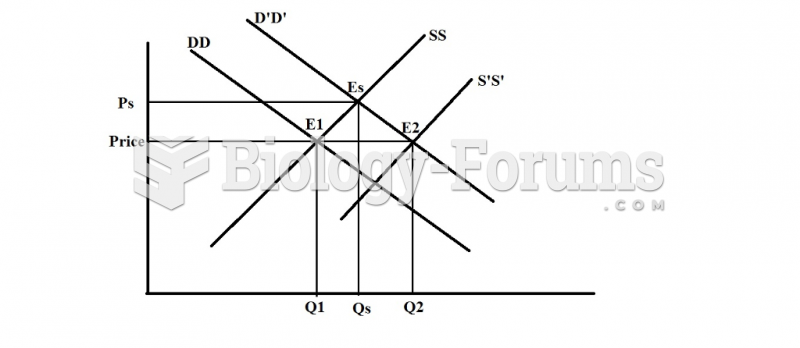 Economics question
 Economics question
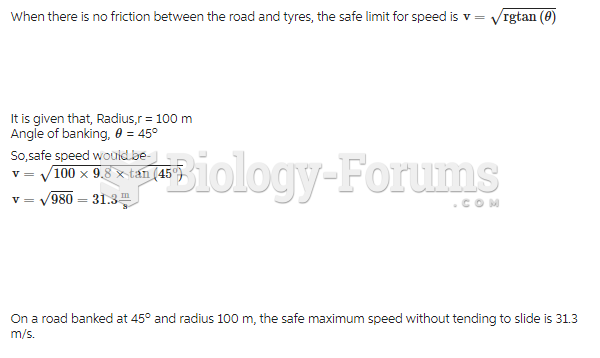 A highway curve of radius 80 m is banked at 45°. Suppose that an ice storm hits, and the ...