Question 1
Answer the question using the value of r and the given best-fit line on the scatter diagram.

The scatter diagram and best-fit line show the data for the number of cars waiting by a school (y) and the amount of time after the end of classes (x). The correlation coefficient r is -0.55. Predict the number of cars at time 8 after the end of classes.
◦ 5
◦ 7
◦ No valid prediction is possible.
◦ 6
Question 2
Answer the question using the value of r and the given best-fit line on the scatter diagram.

The scatter diagram and best-fit line show the data for price per item (y) and the availability of that
item (x). The correlation coefficient r is -0.95. Predict the price per item for an availability of 3.
◦ 6.8
◦ No valid prediction is possible.
◦ 7.8
◦ 8.8

 How to solve word problems with two unknowns (Question 4)
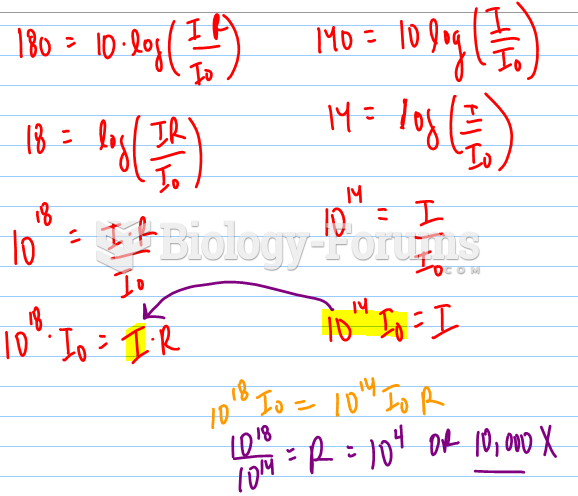 Sound intensity log question
 this is a math question
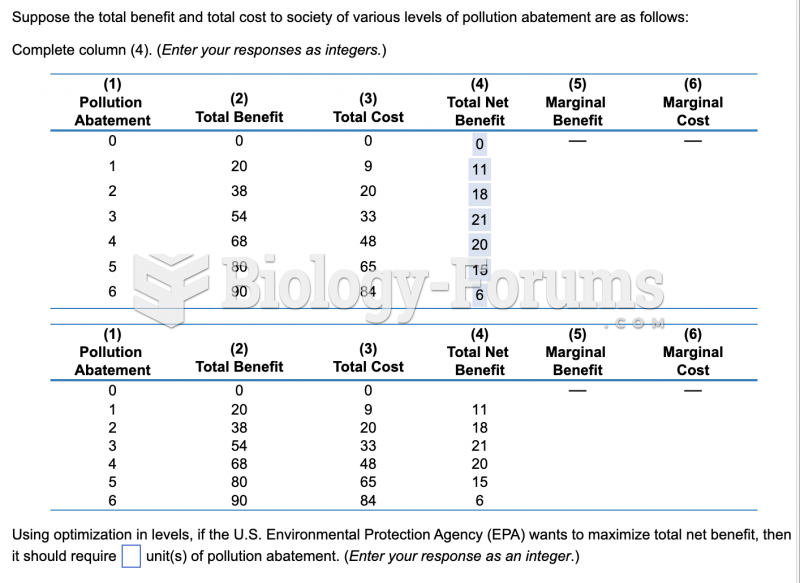 economic question
 economic question
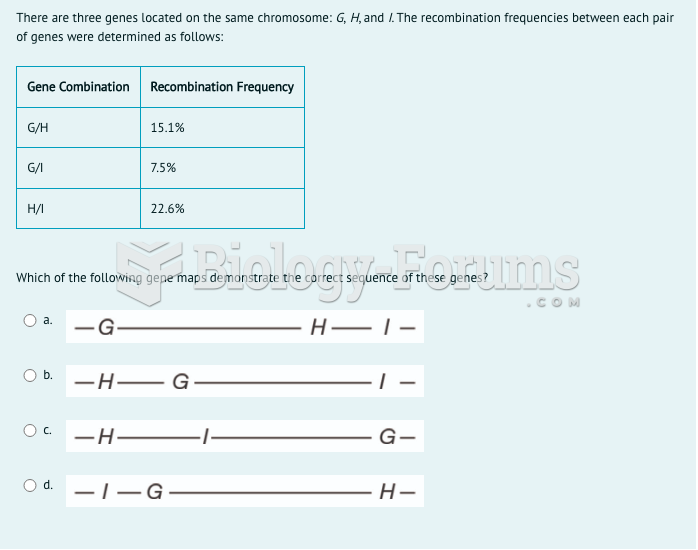 PEDIGREE TO ANALYZE AND ANSWER IMAGE PLEASE