A large national bank charges local companies for using their services. A bank official reported the results of a regression analysis designed to predict the bank's charges (
y), measured in dollars per month, for services rendered to local companies. One independent variable used to predict service charge to a company is the company's sales revenue (
x), measured in $ million. Data for 21 companies who use the bank's services were used to fit the model
E(y) = β0 + β1x.
The results of the simple linear regression are provided below.

= 2,700 + 20
x,
s = 65, 2-tailed
p-value = .064 (for testing
β1)
Interpret the
p-value for testing whether
β1 exceeds 0.
◦ For every $1 million increase in sales revenue (
x), we expect a service charge (
y) to increase $.064.
◦ There is insufficient evidence (at
α = .05) to conclude that service charge (
y) is positively linearly related to sales revenue (
x).
◦ Sales revenue (
x) is a poor predictor of service charge (
y).
◦ There is sufficient evidence (at
α = .05) to conclude that service charge (
y) is positively linearly related to sales revenue (
x) .

 Albatrosses, of the biological family Diomedeidae, are large seabirds
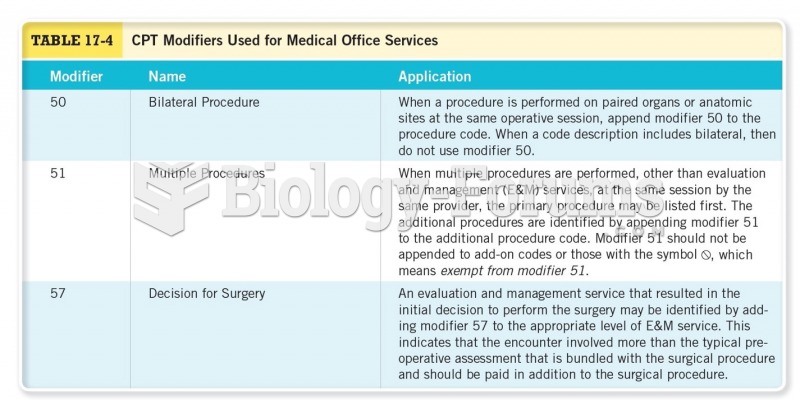 CPT Modifiers Used for Medical Office Services Cont.
 Do you know what that large object in the center of the photo is? In the 1920s, 30s, and 40s, ...
 Local Winds
 The Tragically Hip - Ahead By A Century (Official Music Video)