This topic contains a solution. Click here to go to the answer
|
|
|

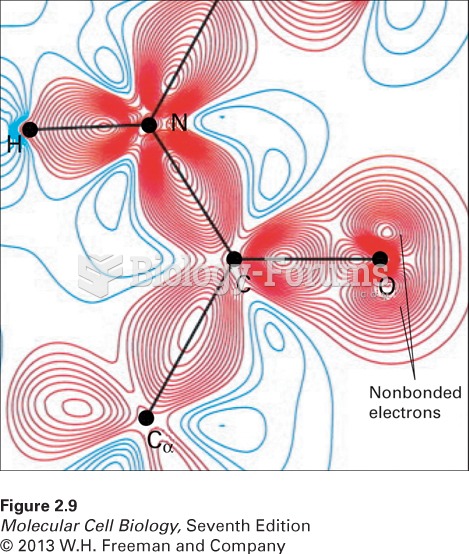 Distribution of bonding and outer nonbonding electrons in the peptide group
 At breakfast, a middle-class husband sits absorbed in the newspaper and the public affairs of the da
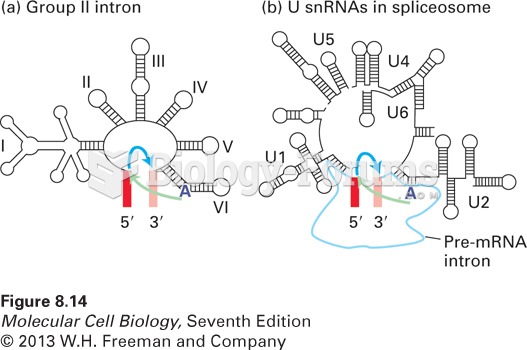 Comparison of group II self-splicing introns and the spliceosome
 This 19-year-old in Wisconsin was given a reduced jail sentence for holding this sign in front of ...
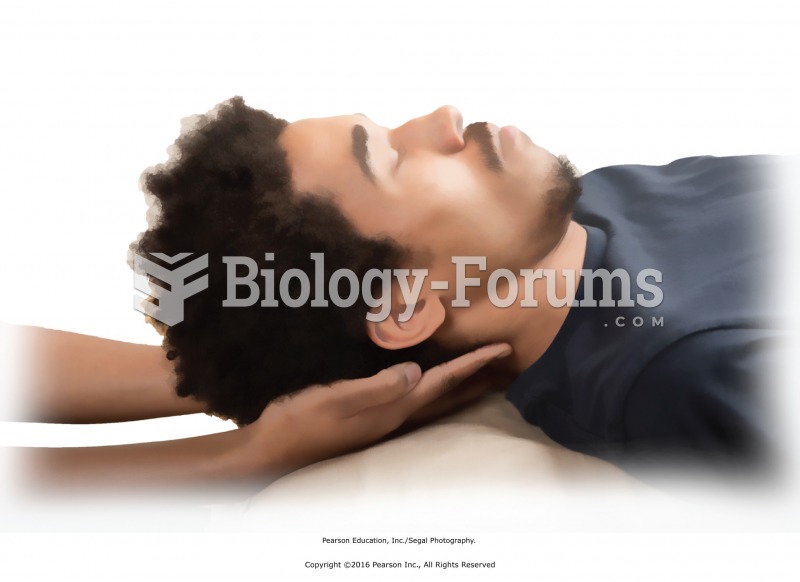 The cradle. Rest your hands on the table, supporting the recipient’s head in your palms. Your ...
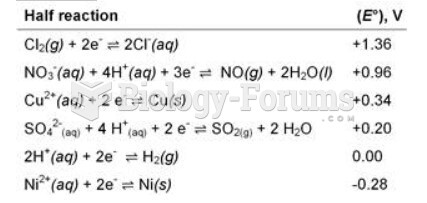 table
table