This topic contains a solution. Click here to go to the answer
|
|
|

 Examples of modified aboveground roots.
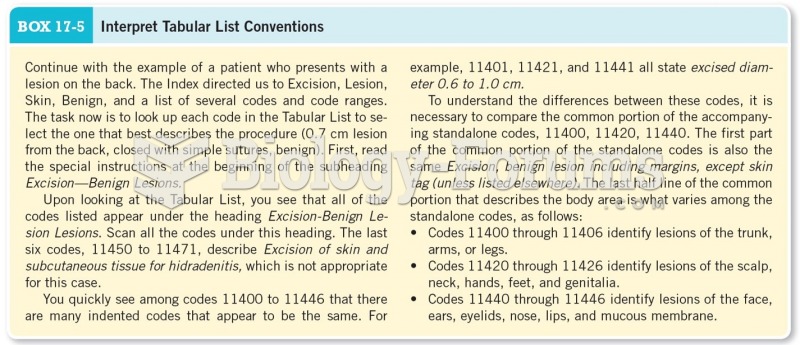 Interpret Tabular List Conventions
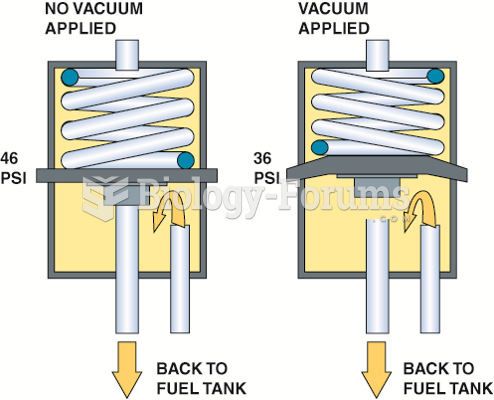 A typical fuel-pressure regulator that has a spring that exerts 46 pounds of force against the ...
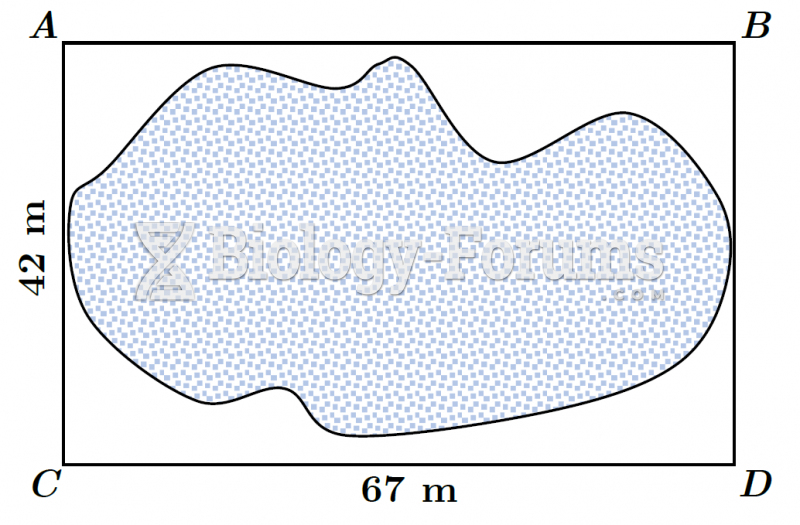 Plot of Land (Modified Offset Method) - Boxed
 Ladder with weights
 Ladder with weights