This topic contains a solution. Click here to go to the answer
|
|
|

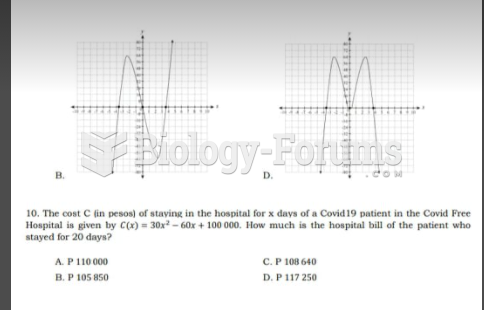
 Chart to answer QN
 In this cartoon, Boss Tweed welcomes cholera—a skeletal figure of death carrying a handbag from “Asi
 answer only
 Please fully explain the answer with steps
 Answer
 For the circuit in Figure 1, assume ideal diodes. The peak inverse voltage is approximately