This topic contains a solution. Click here to go to the answer
|
|
|

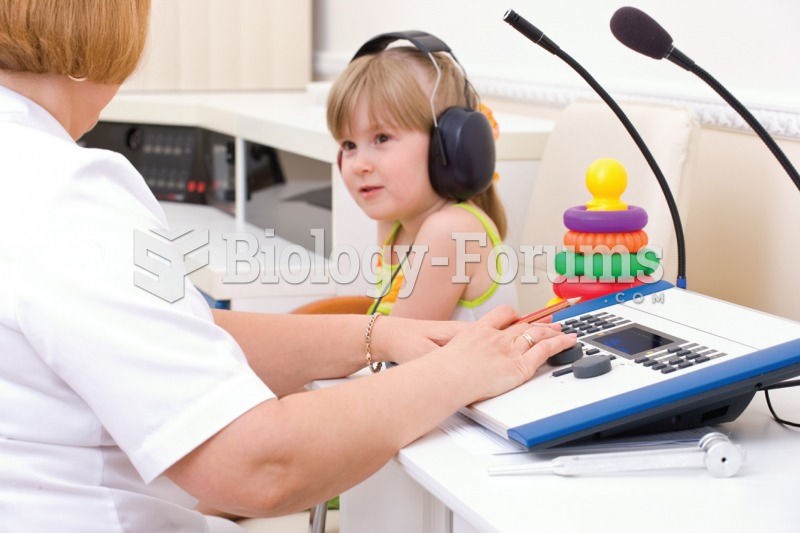 Audiometry. The child in this photograph is undergoing a hearing test with an audiologist.
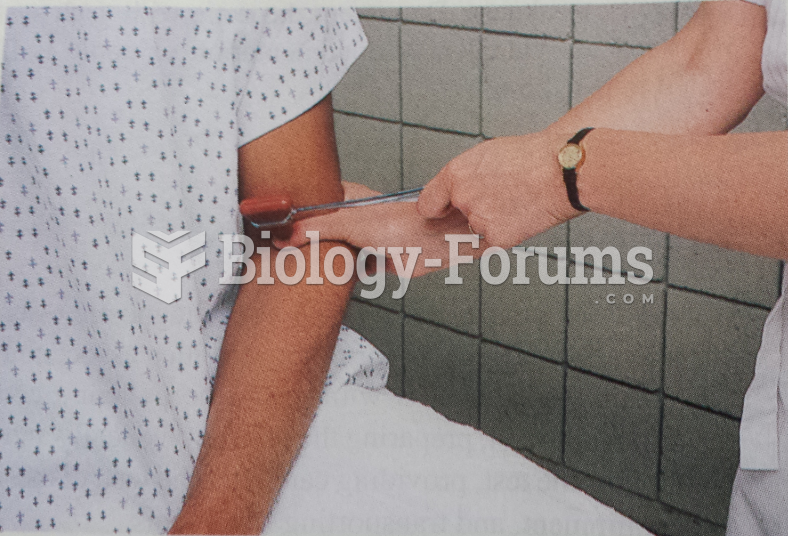 Biceps Reflex Test
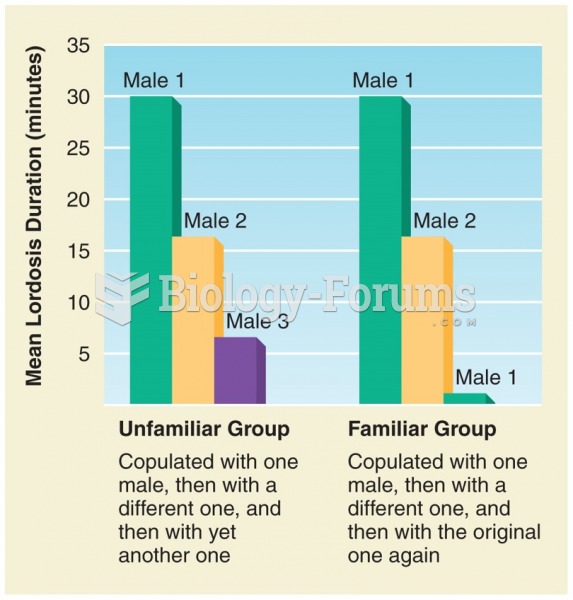 The experimental design and results of Lester and Gorzalka (1988). On the third test, the female ...
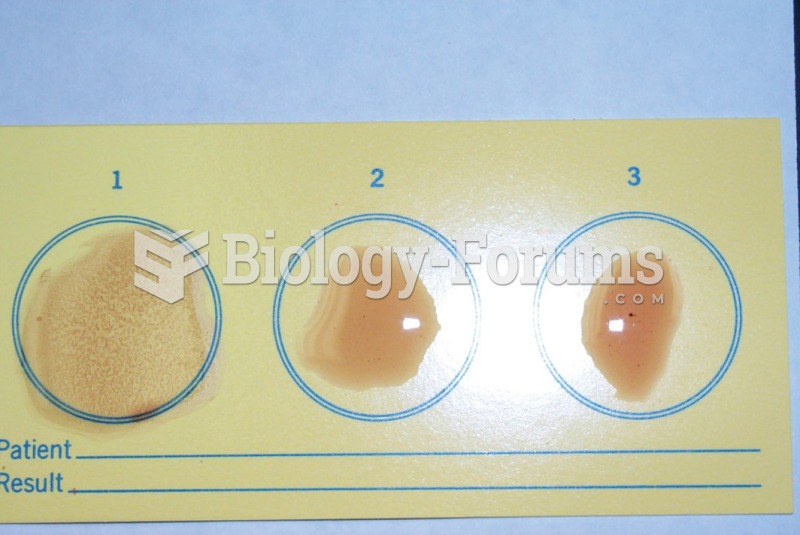 A Mono-Diff test in which the presumptive well contains the patient's serum mixed with ...
 Testing coordination by using the finger-to-finger test
 Samples of the DNA separated by gel electrophoresis