This topic contains a solution. Click here to go to the answer
|
|
|

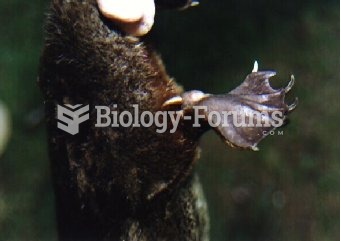 The calcaneus spur found on the male's hind limb is used to deliver venom.
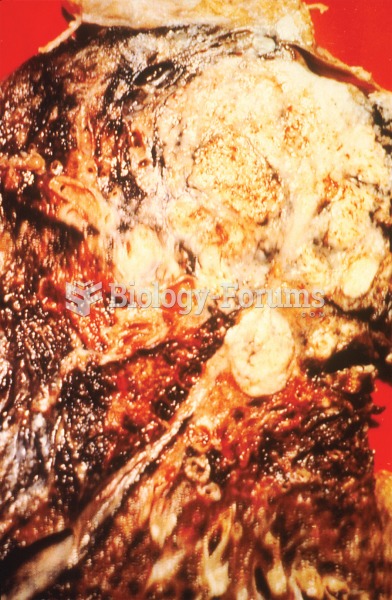 Lung cancer. Photograph of part of a lung removed after death. The yellow area is a large tumor and
 Hormonal control of the male reproductive hormones
 Variable expressivity as shown in flies homozygous for the eyeless mutation in Drosophila
 How to impress a choosy female:
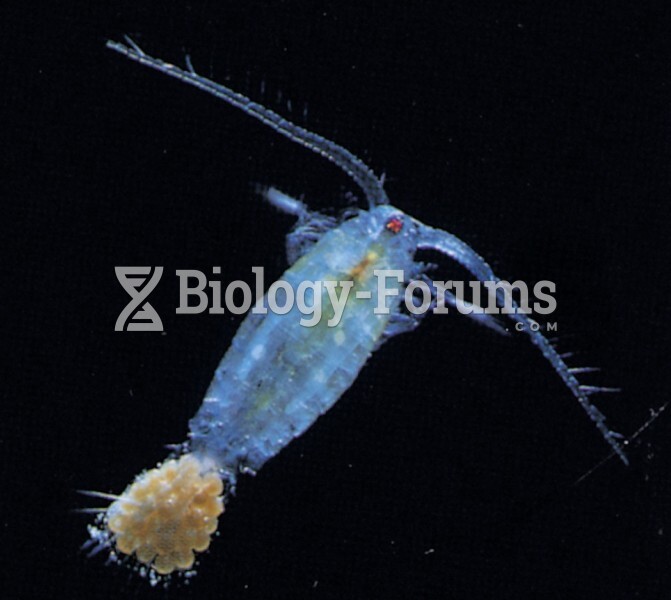 Female copepod with eggs