This topic contains a solution. Click here to go to the answer
|
|
|

 Comet 67P/Churyumov-Gerasimenko from a distance of just 29 kilometres (ESA)
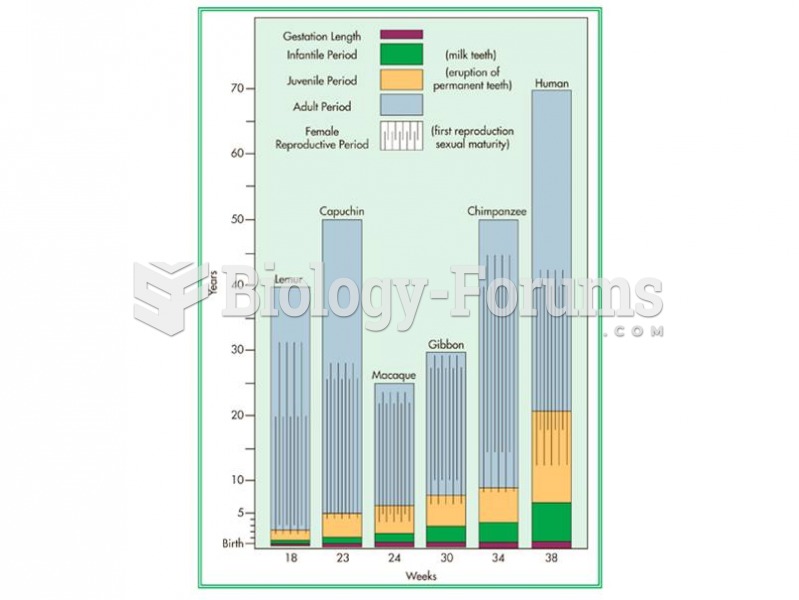 Primates exhibit prolonged life histories, spending more time in each stage of life than most other
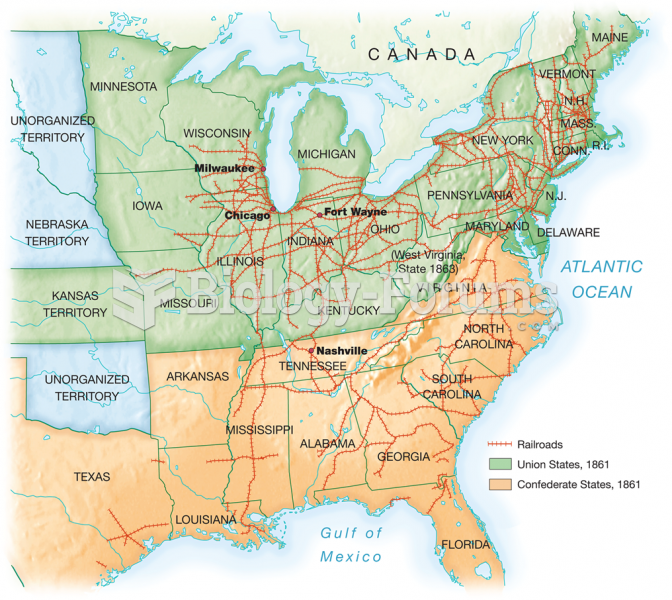 Major trunk lines carrying long-distance traffic crisscrossed the area east of the Mississippi. The
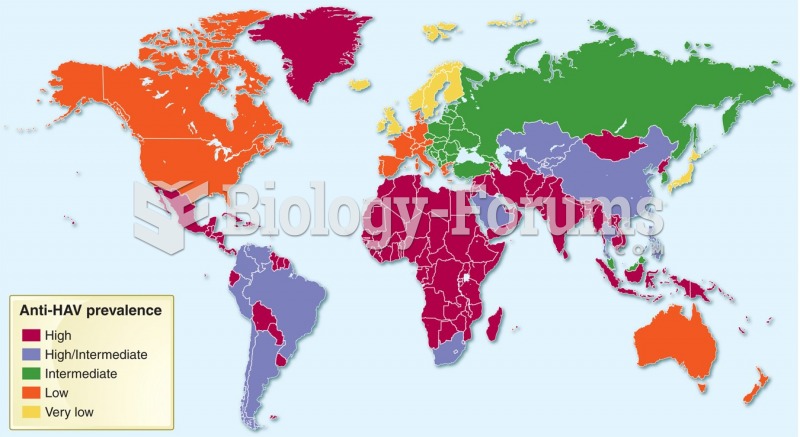 Geographic distribution of hepatitis A prevalence (anti-HAV-antibody), 2005.
 Composition of a long bone
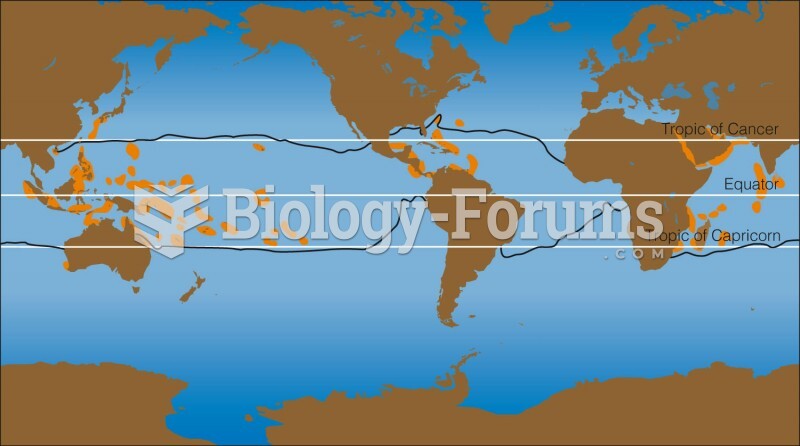 Distribution of coral reefs