So, the first thing you want to do is graph the points where it crosses the x-axis. This is going to be where the slope of the original equals zero (this makes sense right, because derivative is just slope and the slope = zero there). This is at the extrema (max and min). Then, you estimate the slopes of the other parts of the graph using the average slope formula ( f(b) - f(a) ) divided by (b - a), where b and a are x-values that you chose to approximate slope for. Sketch in a nice fit ^_^
A good way to check to see that you did it right is to look at what type of function the derivative graph is (linear, quadratic, etc.). It should always be of degree ONE LESS than the original, meaning the highest power is one less than that of the original function. Hope this helps!

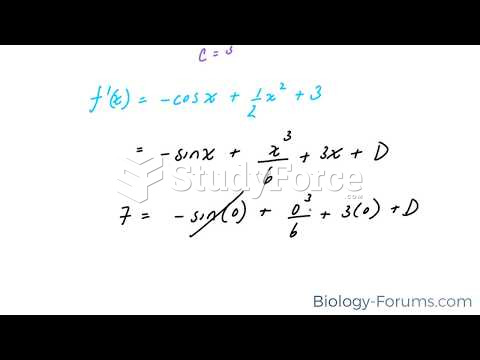 How to find the constant (C) after finding the anti-derivative
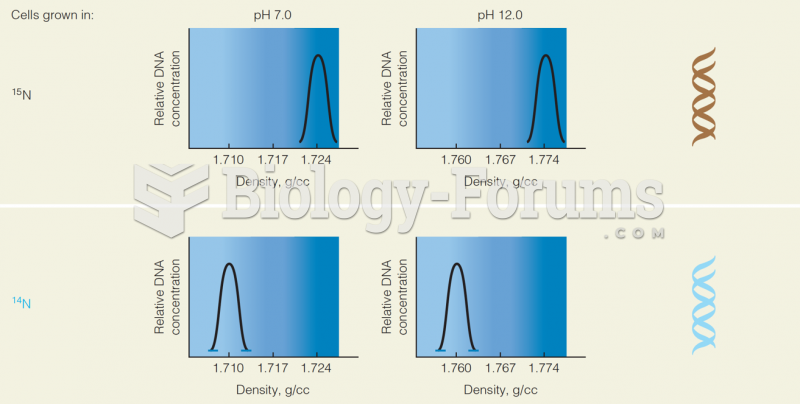 Cell Grown in 15N and 14 N: Graph of Relative DNA Concentration Vs. the Density
 Model for translocon function
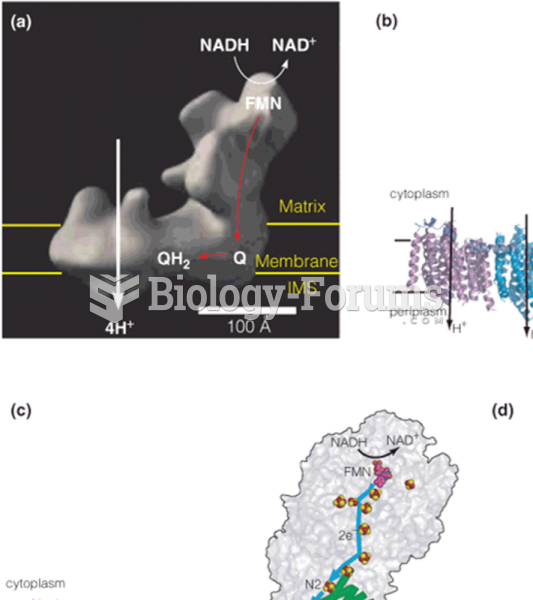 Structure and function of complex I (NADH–coenzyme Q reductase)
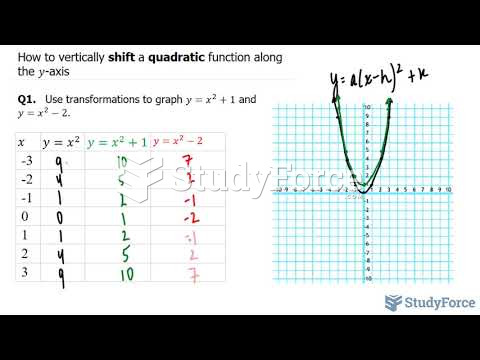 How to vertically shift a quadratic function along the y-axis
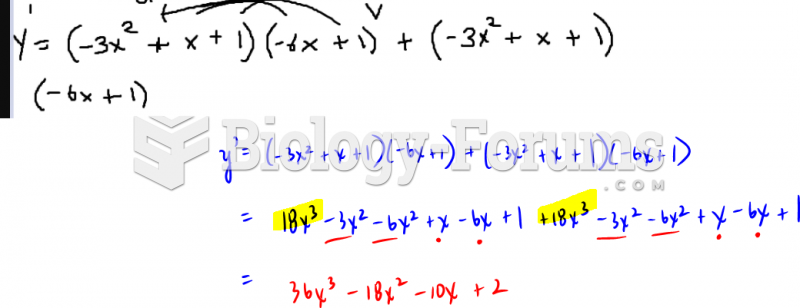 Use the product rule to find derivative