This topic contains a solution. Click here to go to the answer
|
|
|

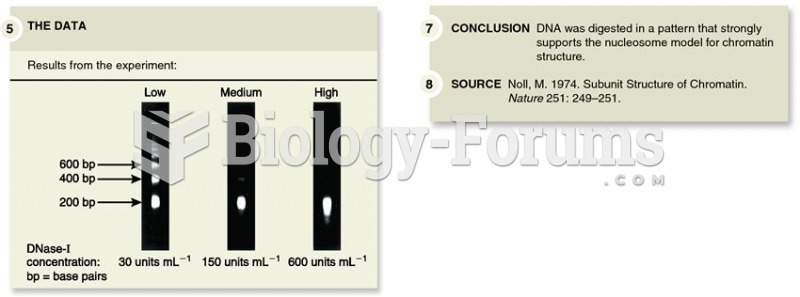 Noll's DNase-I digestion experiment, which verified the beads-on-a-string model of DNA compacti
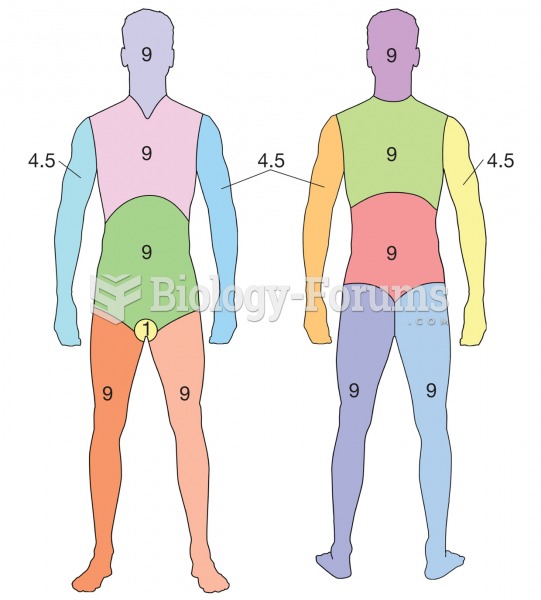 Rule of Nines. A method for determining percentage of body burned. Each different colored section re
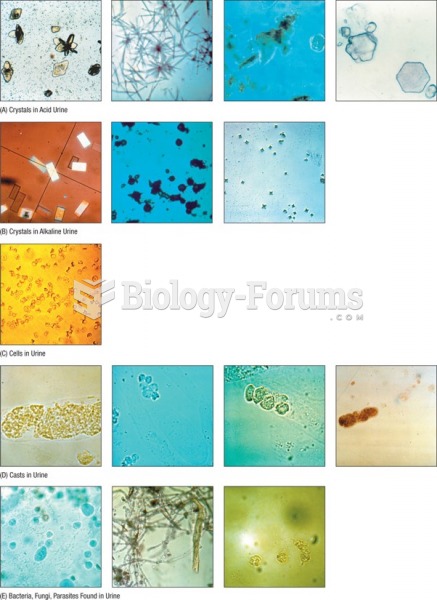 Urine sediment chart.
 Chart
Chart
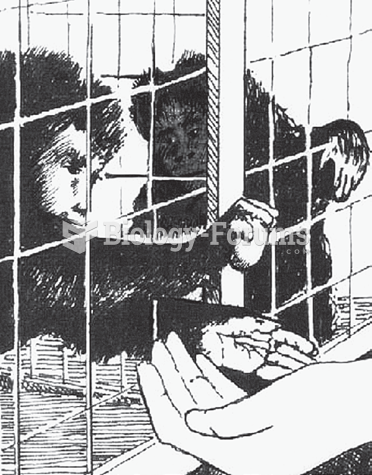 Monkey Experiment: Sense of Fairness
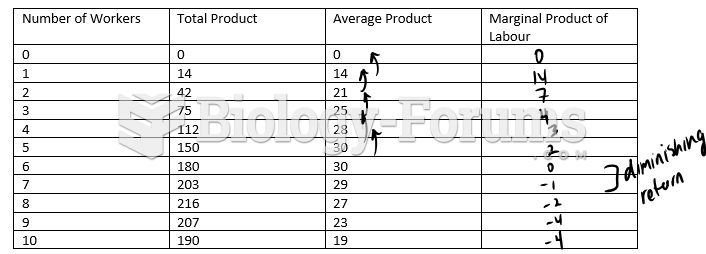 Complete the following production chart and plot the points.