This topic contains a solution. Click here to go to the answer
|
|
|

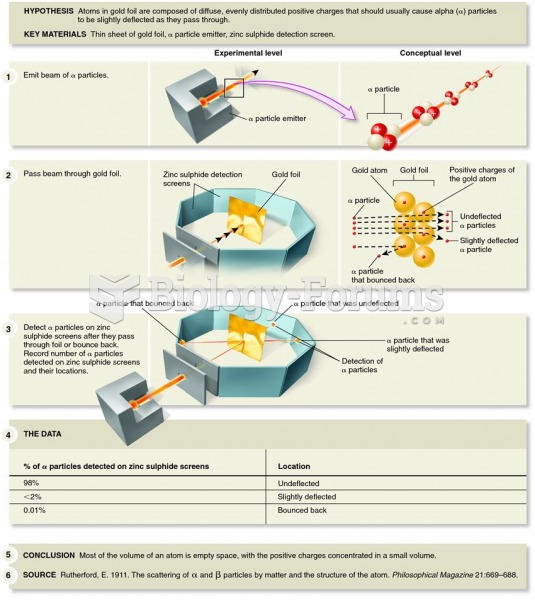 Rutherford's gold foil experiment demonstrating that most of the volume of an atom is empty spa
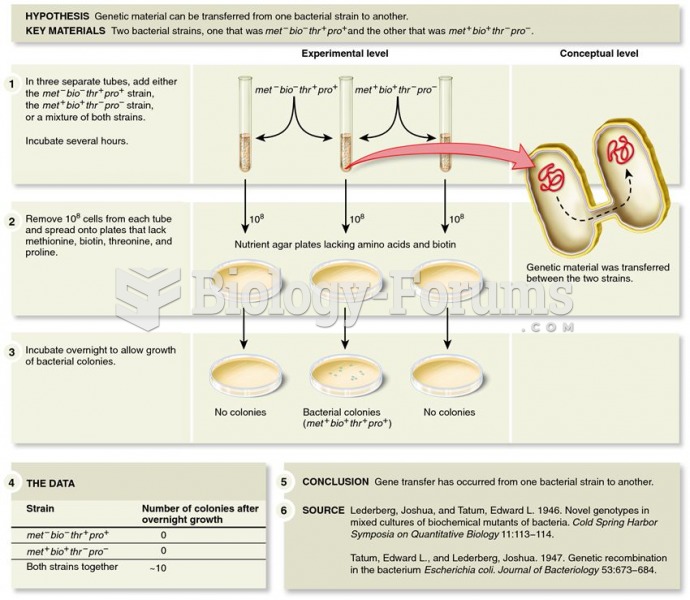 Experiment of Lederberg and Tatum demonstrating gene transfer in E. coli
 Palpation of the Liver, Hook Method
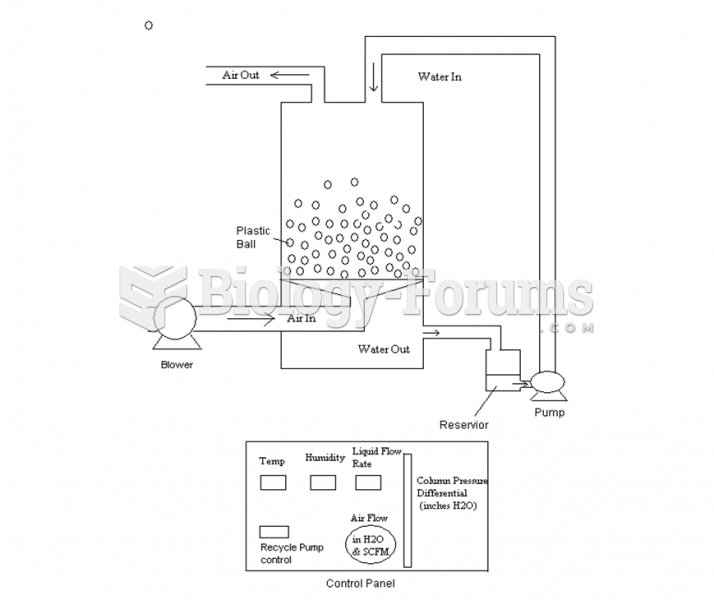 Experimental Apparatus for Fluidization Experiment
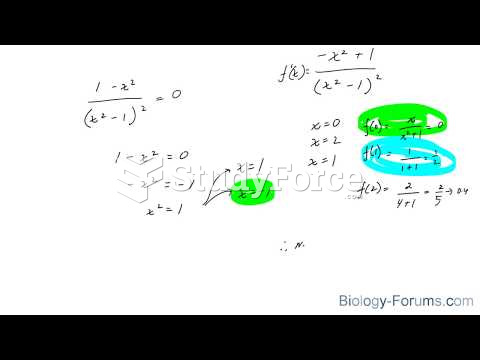 How to use the closed interval method to find absolute maximum and minimum values
 A 2.000 g sample of water contains 11.19% H by mass and 88.81% O by mass. What mass of H will ...