This topic contains a solution. Click here to go to the answer
|
|
|

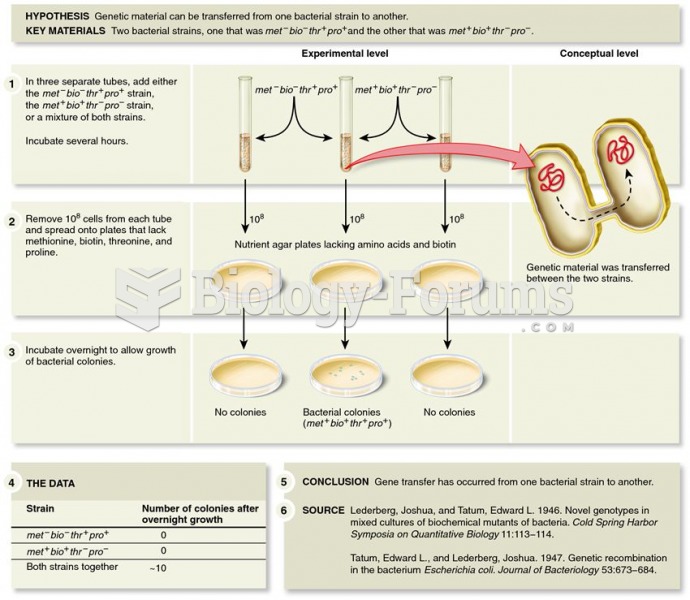 Experiment of Lederberg and Tatum demonstrating gene transfer in E. coli.
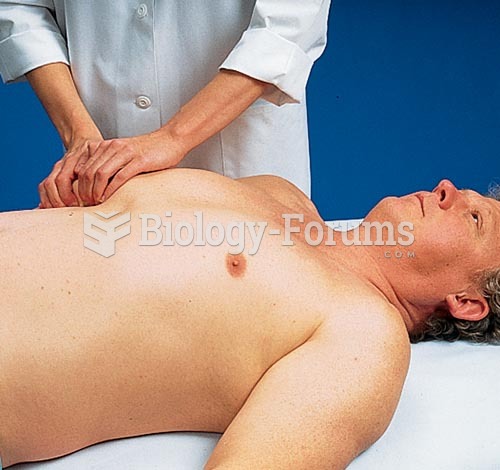 Palpation of the Liver, Hook Method
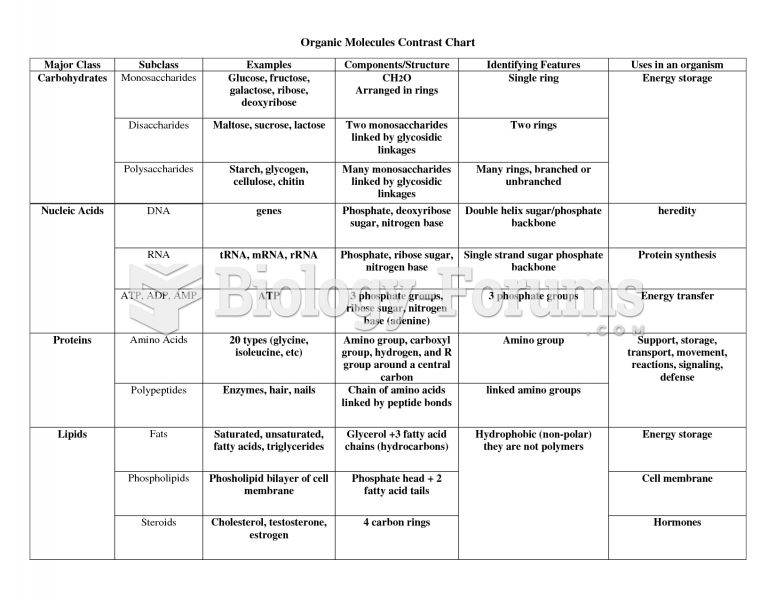 Ochem molecule contrast chart
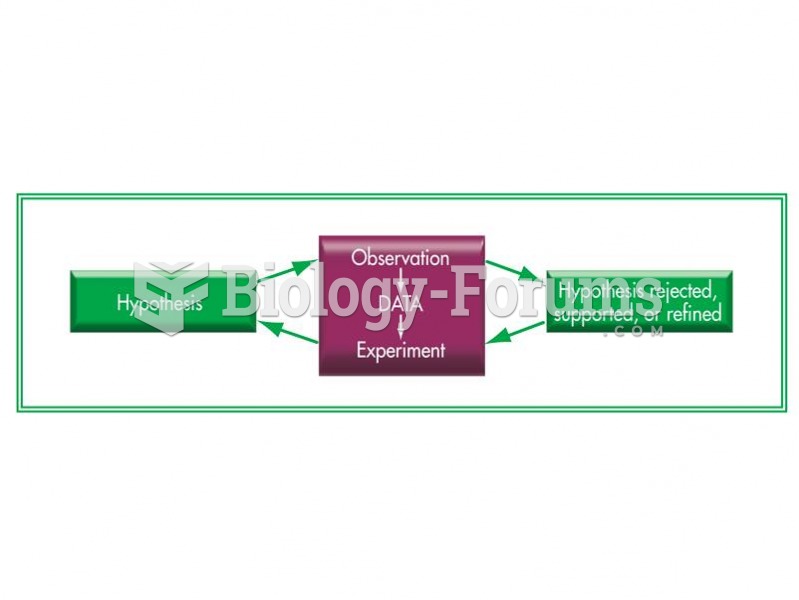 The scientific method.
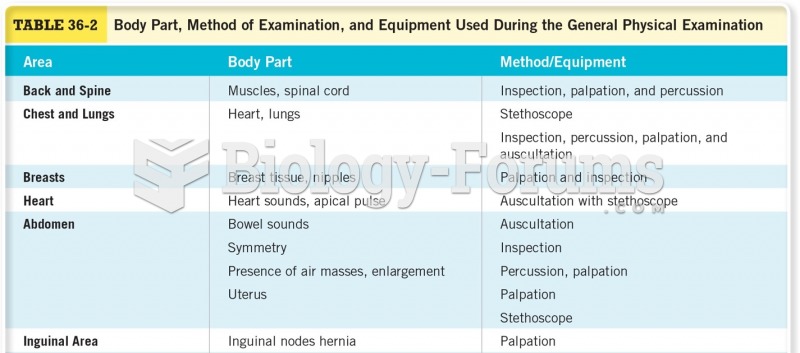 Body Part, Method of Examination, and Equipment Used During the General Physical Examination Cont.
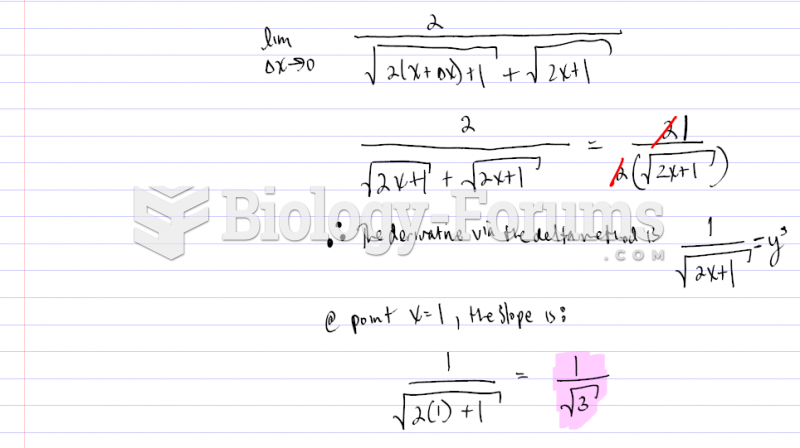 Derive the following using the increment/delta method and find its slope