This topic contains a solution. Click here to go to the answer
|
|
|

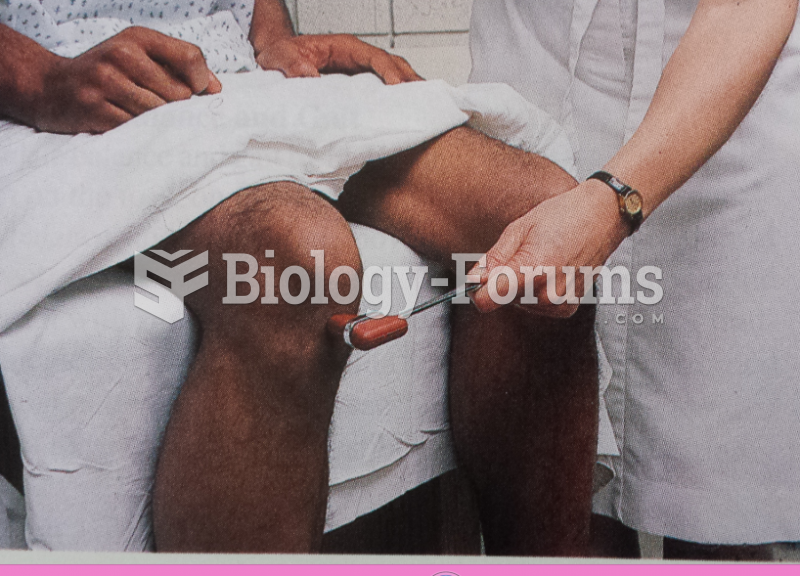 Knee Reflex Test
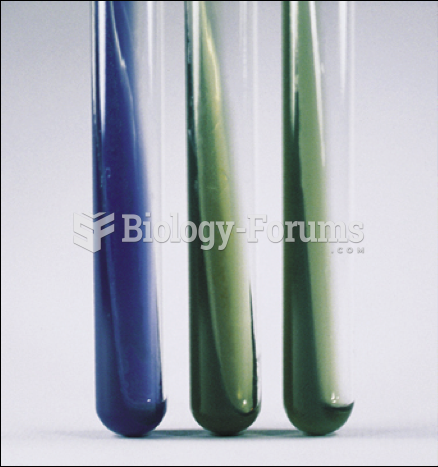 Simmon's Citrate Test
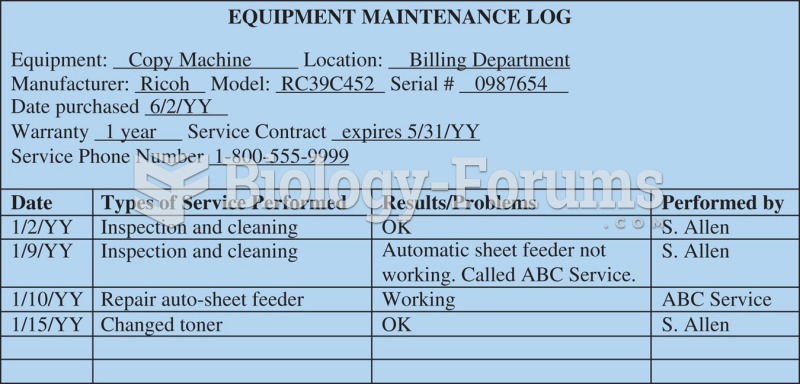 Sample equipment maintenance log.
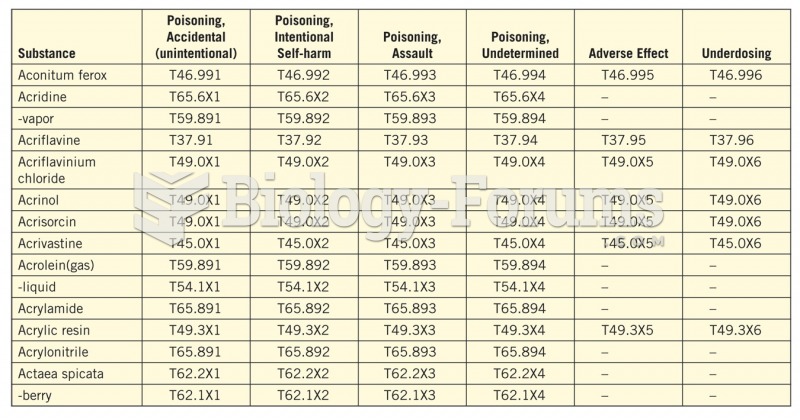 Example of the Table of Drugs and Chemicals.
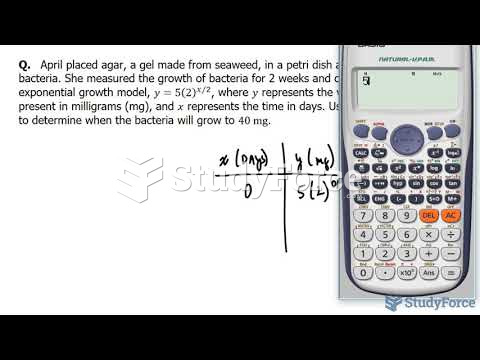 How to solve an exponential problem using a table of values (Question 2)
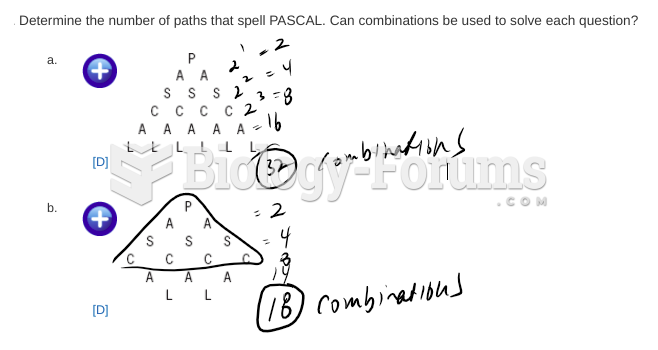 Data management questions