This topic contains a solution. Click here to go to the answer
|
|
|

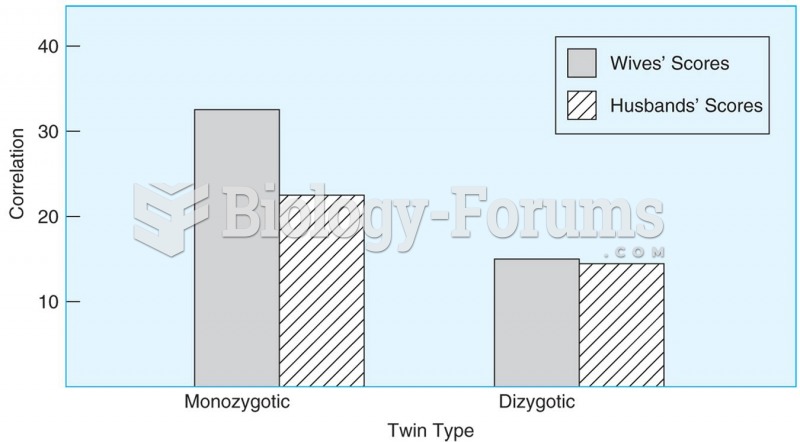 Women who are monozygotic twins and have the same genes are more similar in their marital happiness
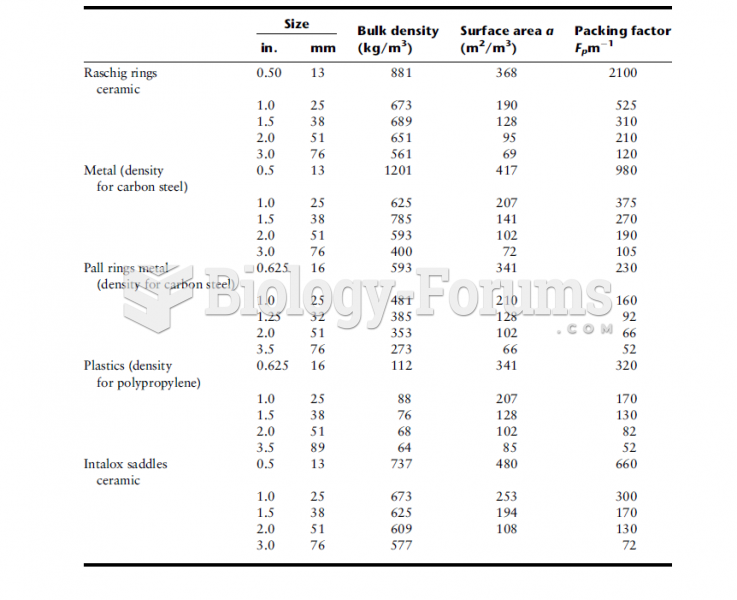 Design Data for Various Packings
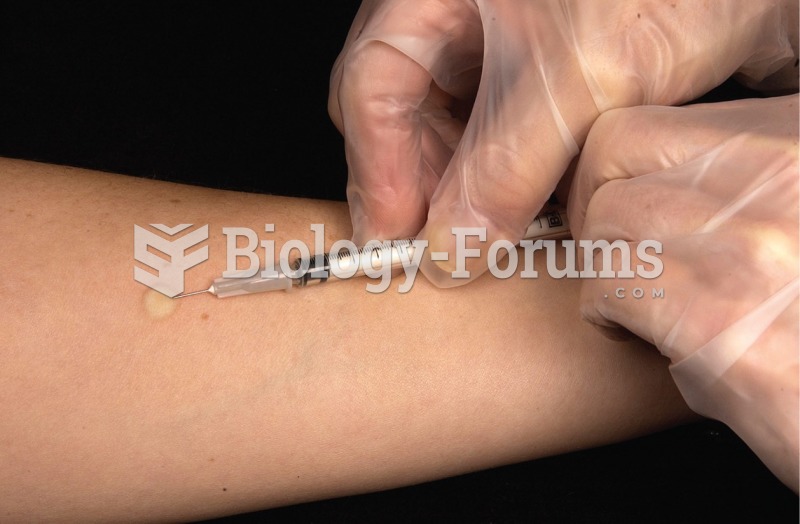 Mantoux tuberculin skin test.
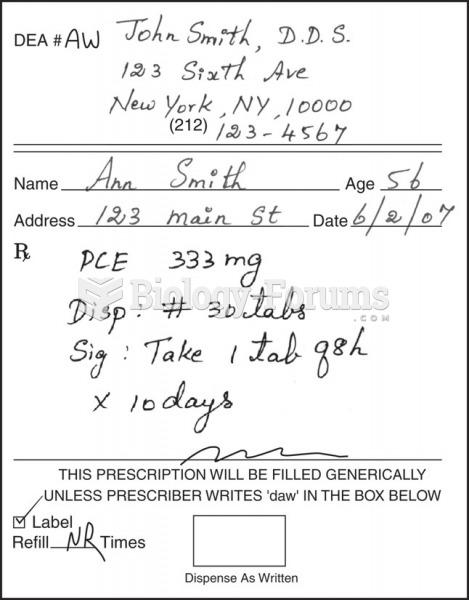 Sample prescriptions of antibiotics for dental infections.
 Table - Correlation Analysis
 Hardy–Weinberg Mating Table for Two Alleles of an Autosomal Gene