This topic contains a solution. Click here to go to the answer
|
|
|

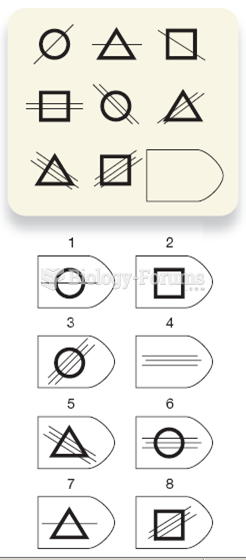 Sample Problem from Raven’s Progressive Matrices
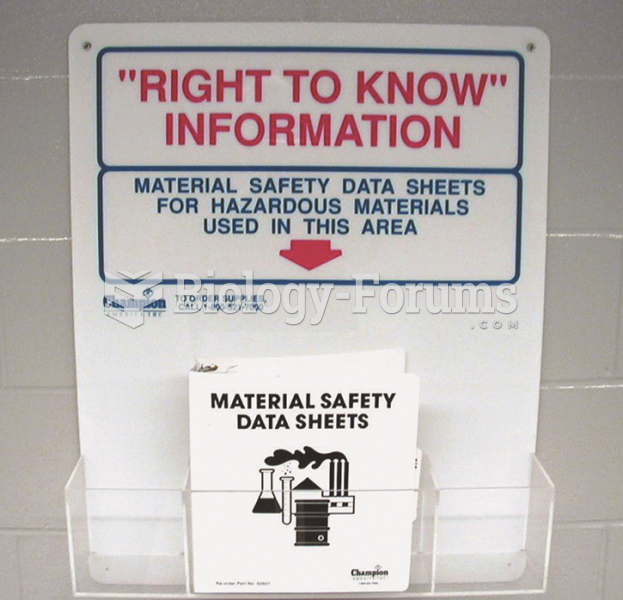 Material safety data sheets (MSDS), now called safety data sheets (SDS), should be readily available ...
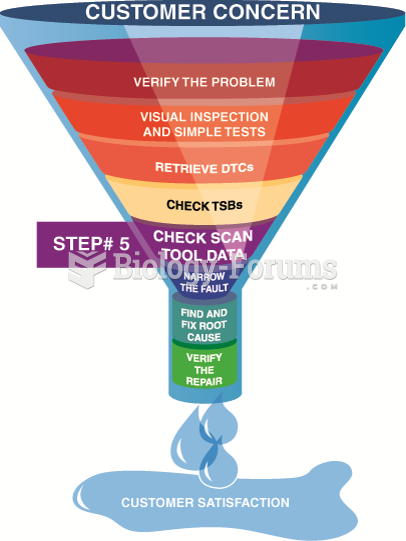 Looking carefully at the scan tool data is very helpful in locating the source of a problem.
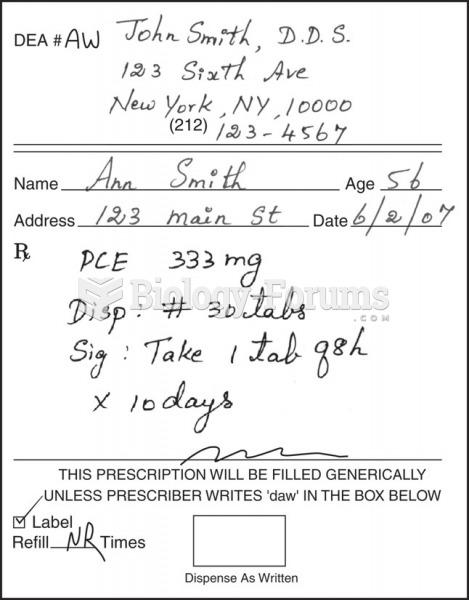 Sample prescriptions of antibiotics for dental infections.
 Sit-and-Reach Test for Overall Flexibility.
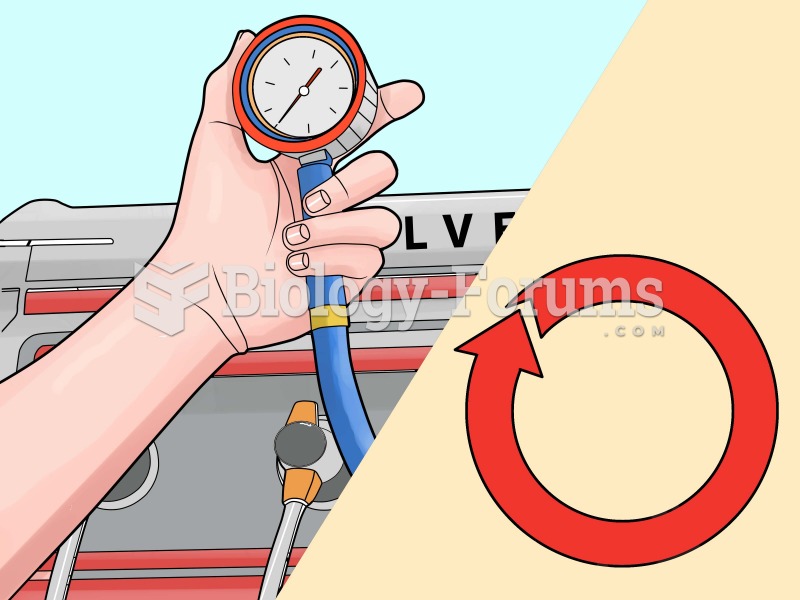 Wet Compression Test