This topic contains a solution. Click here to go to the answer
|
|
|

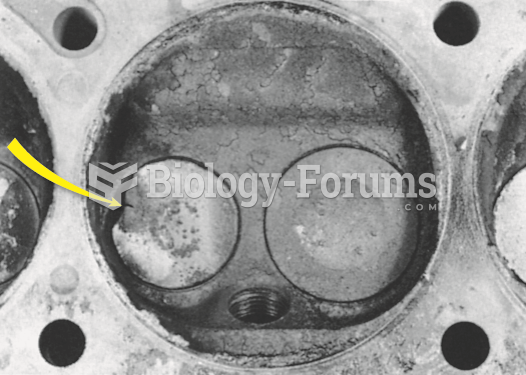 Badly burned exhaust valve. A compression test could have detected a problem, and a cylinder ...
 a) Radioimmunosorbent test (RIST); (b) radioallergosorbent test (RAST).
 Finger-to-nose test
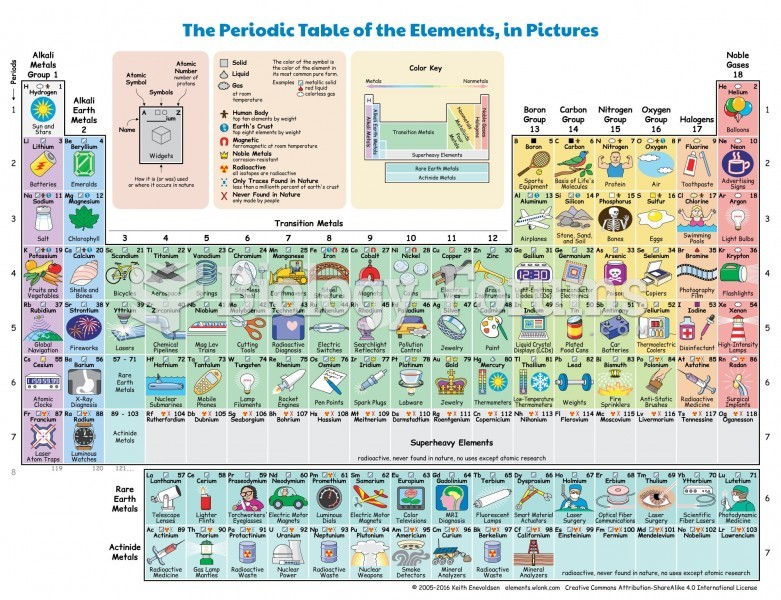 Coolest Period Table EVER
 Seven bacteriophage deletion mutations (1 to 7 in the table below) are tested for their ability ...
 Sample Size Affects Sampling Error