This topic contains a solution. Click here to go to the answer
|
|
|

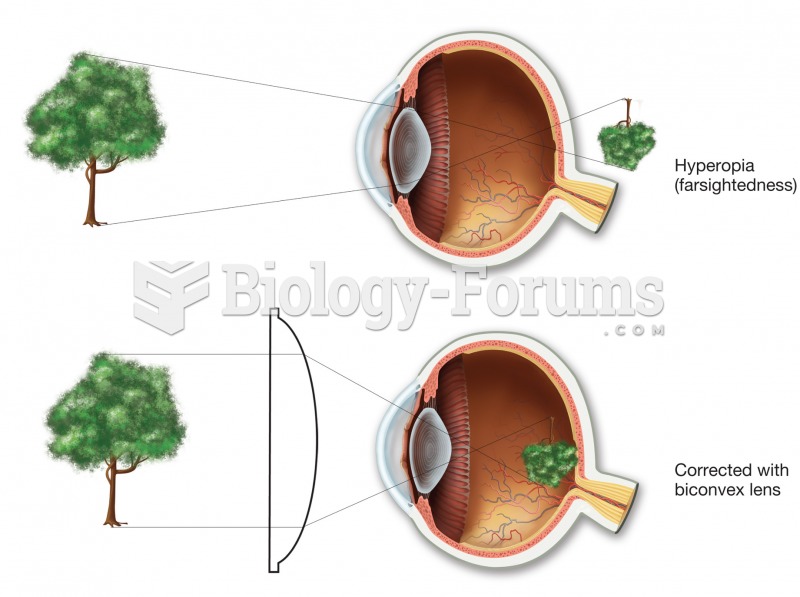 Hyperopia (farsightedness). In the uncorrected top figure, the image would come into focus behind th
 Contact theory indicates that prejudice decreases and relations improve when individuals of ...
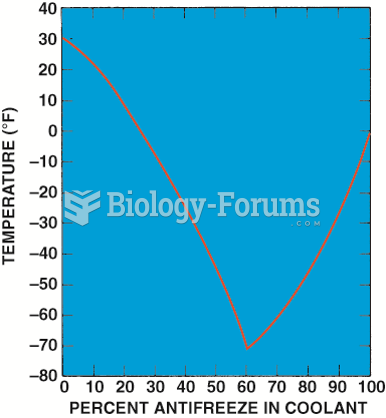 Graph showing the relationship between the freezing point of the coolant and the percentage of ...
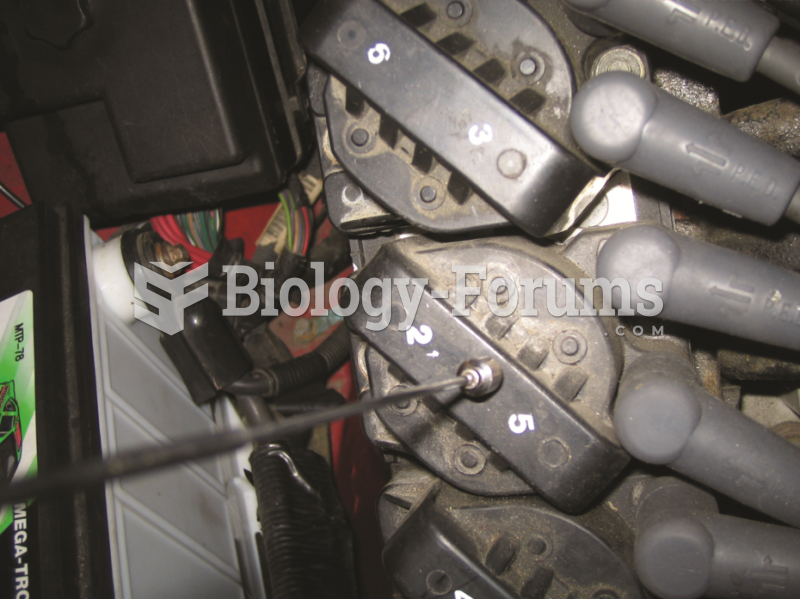 If the coil is working, the end of the magnetic pickup tool will move with the changes in the ...
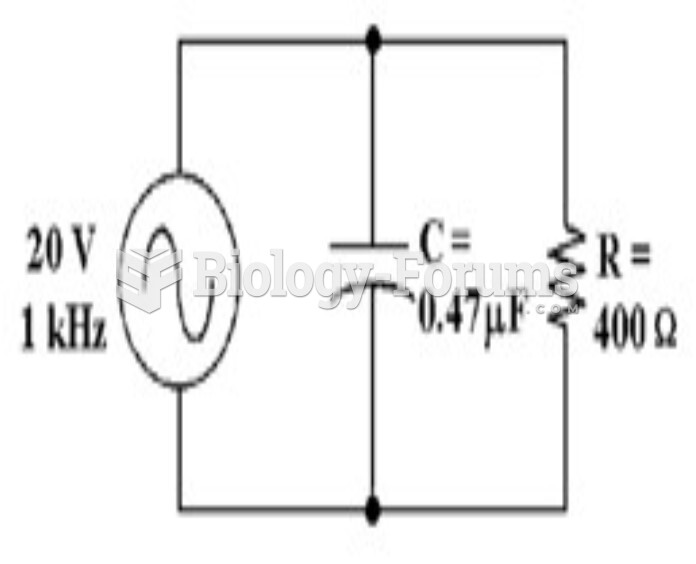 How much voltage does the resistor drop in Figure 10-2? a. 59 mV b. 19.94 V c. 20 V d. 10 V
 Point Mutations