This topic contains a solution. Click here to go to the answer
|
|
|

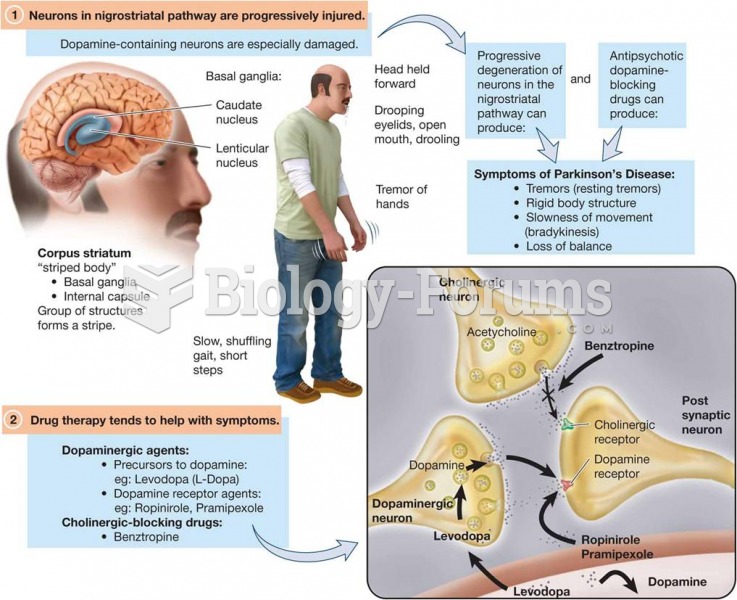 Antiparkinson Drugs Focus on Restoring Dopamine Function and Blocking Cholinergic Activity in the Ni
 How to know when a function is increasing or decreasing using calculus (Part 1)
 World Crude Oil Production and Reserves (Billions of Barrels)
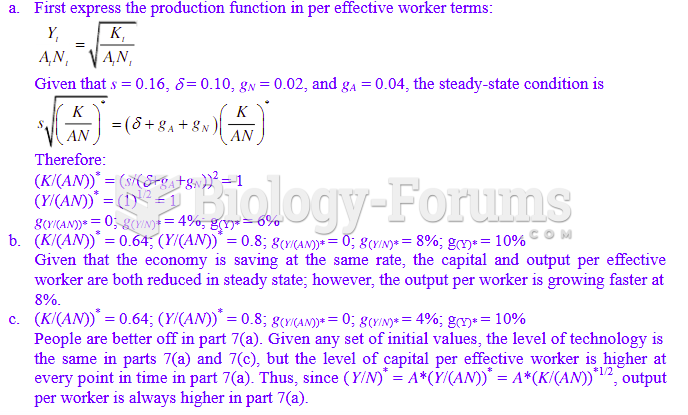 Consider the production function ( ) 0.5 0.5 Y = AK L . Suppose both saving rate (s) and the ...
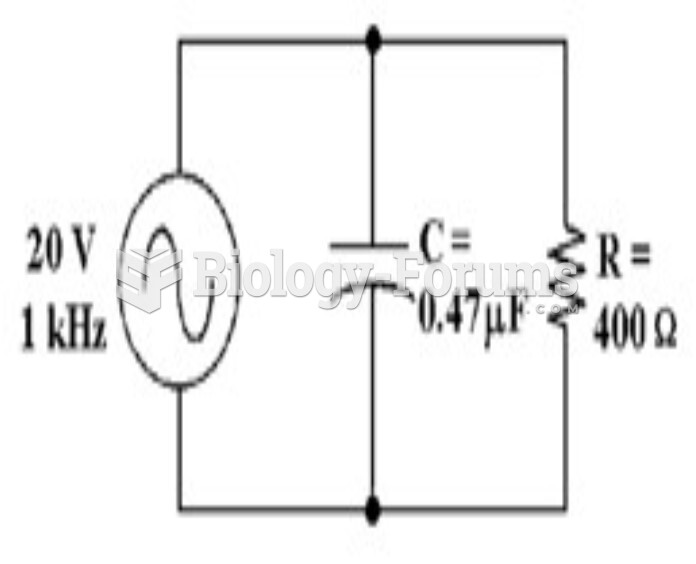 How much voltage does the resistor drop in Figure 10-2?