This topic contains a solution. Click here to go to the answer
|
|
|

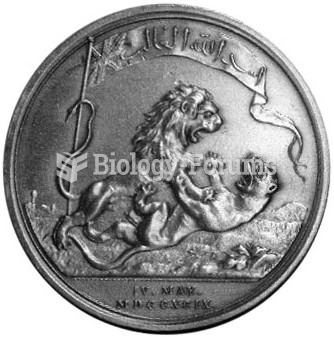 The Seringapatam medal shows a lion defeating a tiger
 Figure and Ground
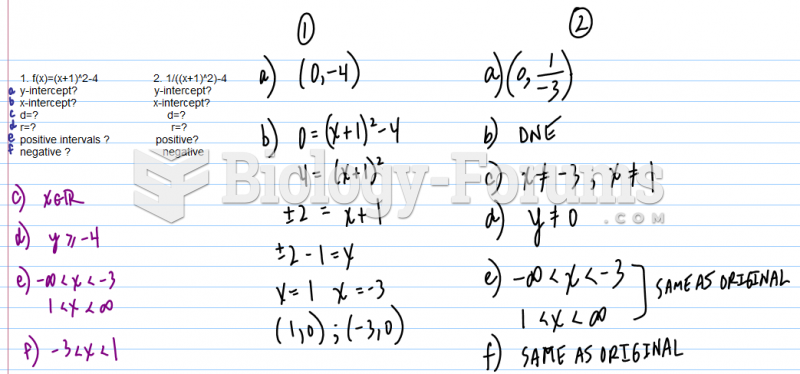 Function Analysis
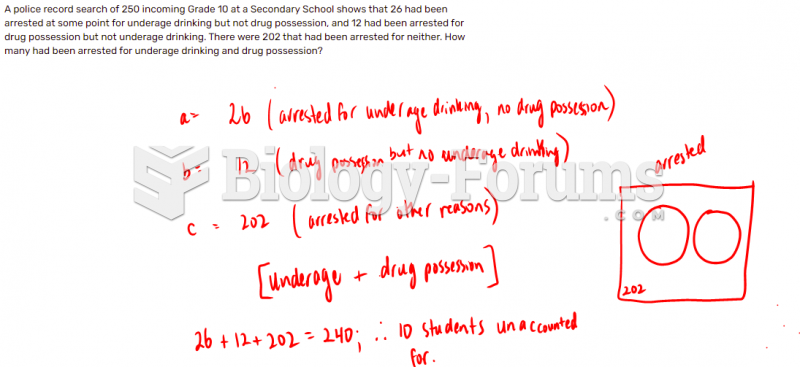 A police record search of 250 incoming Grade 10 at a Secondary School shows that 26 had been ...
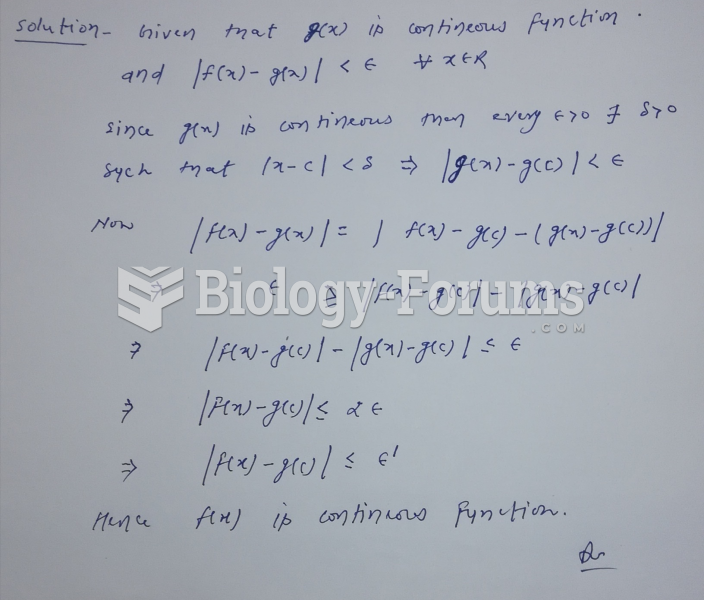 Let f be a real function with domain R. Suppose that for each ǫ > 0, there is a continuous ...
 Production of colorless sectors and reversion of the unstable colorless