This topic contains a solution. Click here to go to the answer
|
|
|

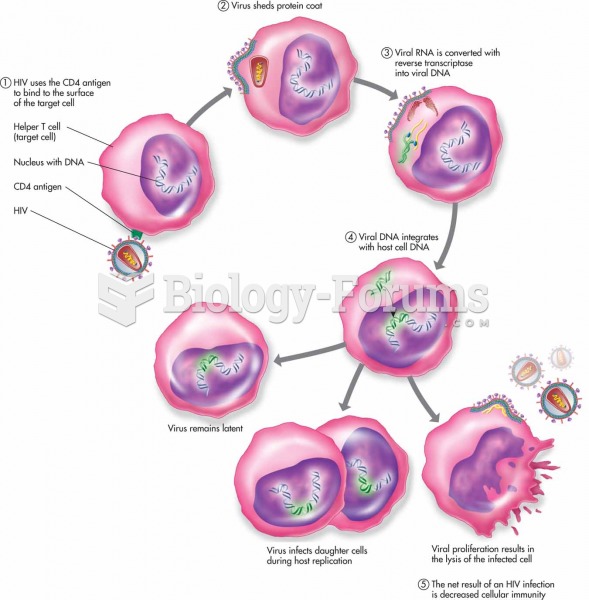 Human immunodeficiency virus gains entry into helper T cells, uses the cell DNA to replicate, interf
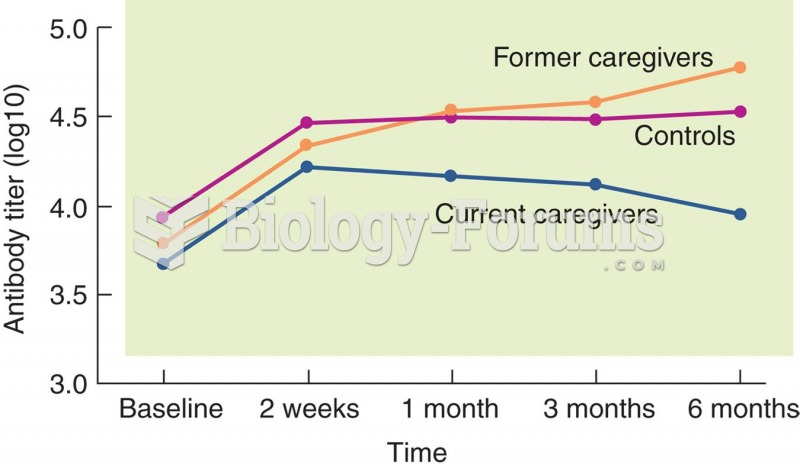 Effect of Stress on Immune Function
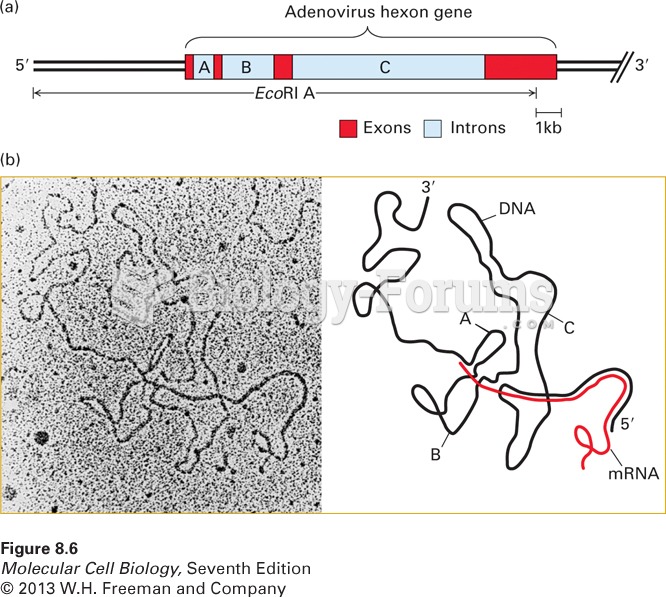 Electron microscopy of mRNA-template DNA hybrids shows that introns are spliced
 The photo shows an ultrasound image of a fetus. The rough outline of a head and body can be seen. ...
 How to plot a sine function containing an amplitude and phase-shift (Question 2 of 3)
 Figure-8s at the knuckles of the hand.