This topic contains a solution. Click here to go to the answer
|
|
|

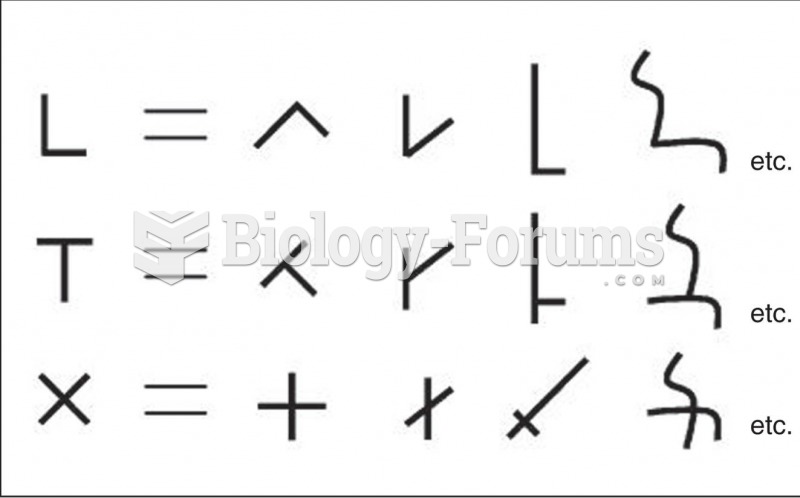 Examples of Ways That Different Types of Intersections of Two Line Segments Can Be Transformed into
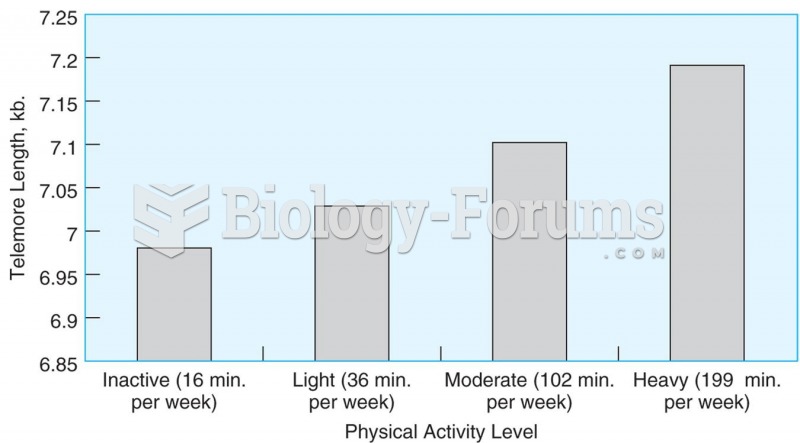 Telomere length is related to the amount of time adults spend in leisure time activity. Source: Ada
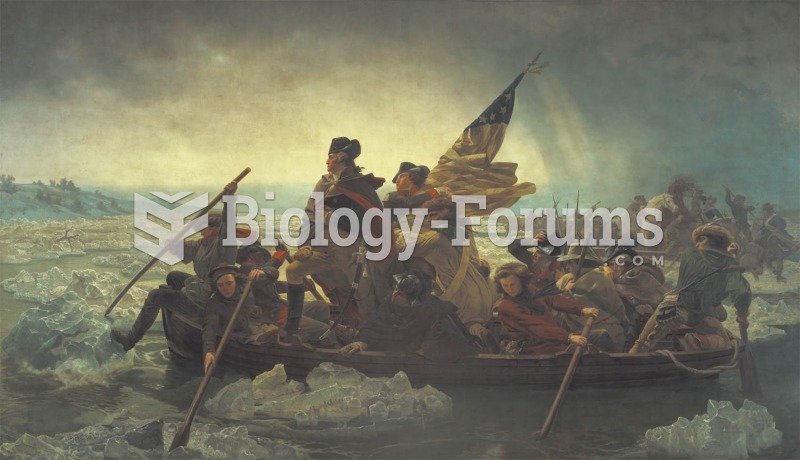 Emanuel Leutze’s Washington Crossing the Delaware (1851) is riddled with historical inaccuracies, mo
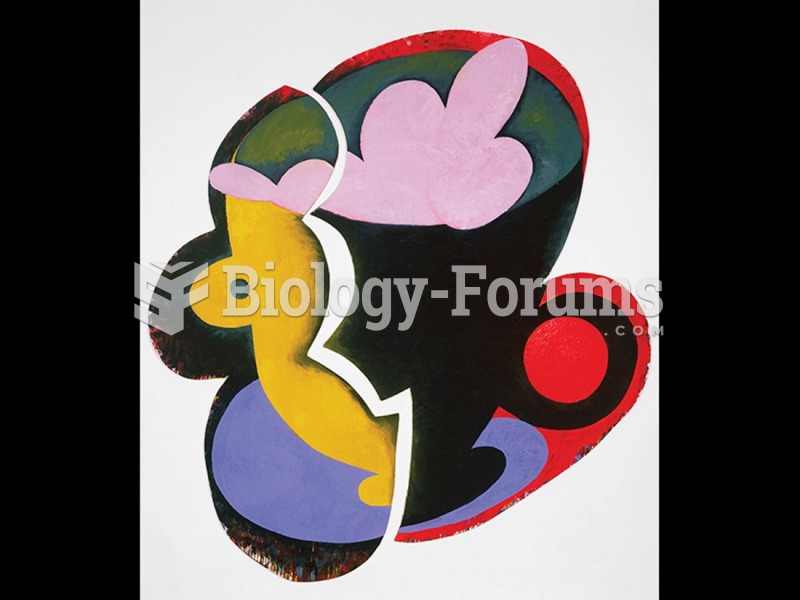 Elizabeth Murray, Just in Time.
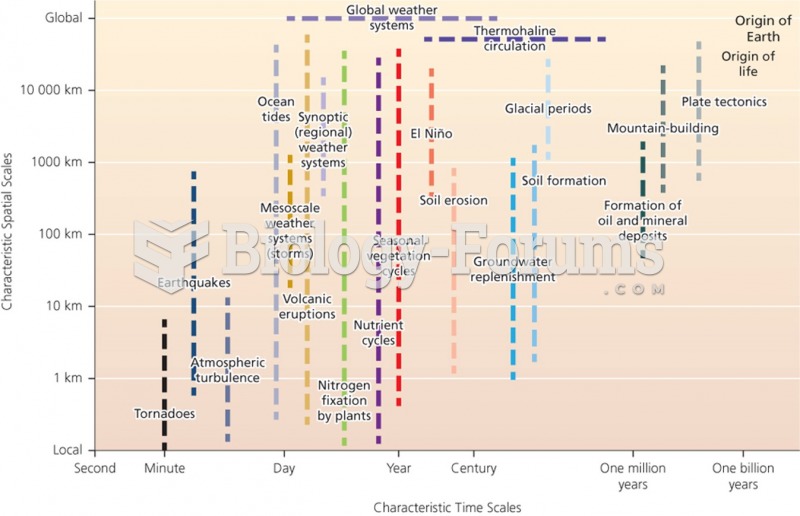 Environmental Systems in Space and Time
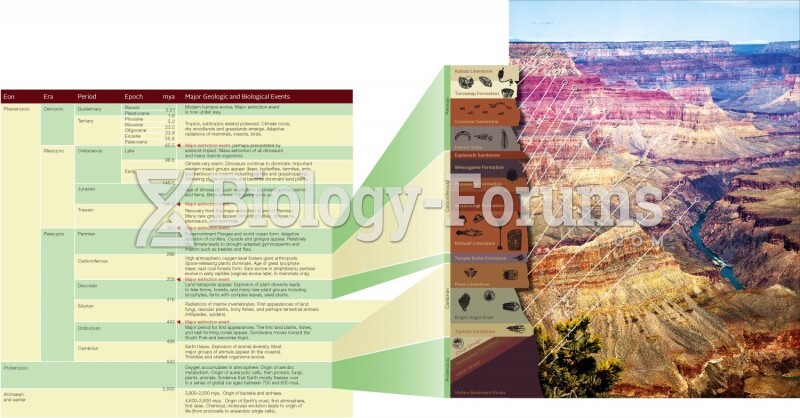 The Geologic Time Scale