This topic contains a solution. Click here to go to the answer
|
|
|

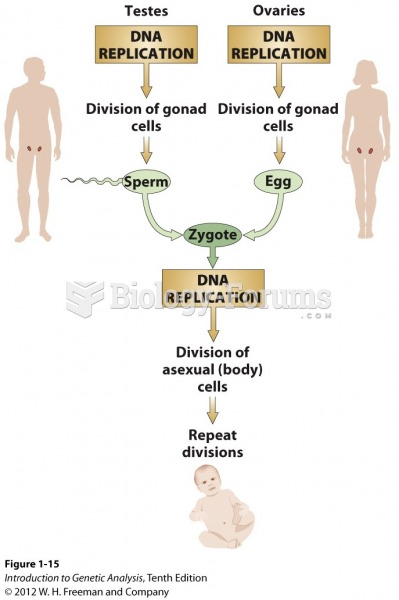 DNA replication is the basis for the perpetuation of life through time
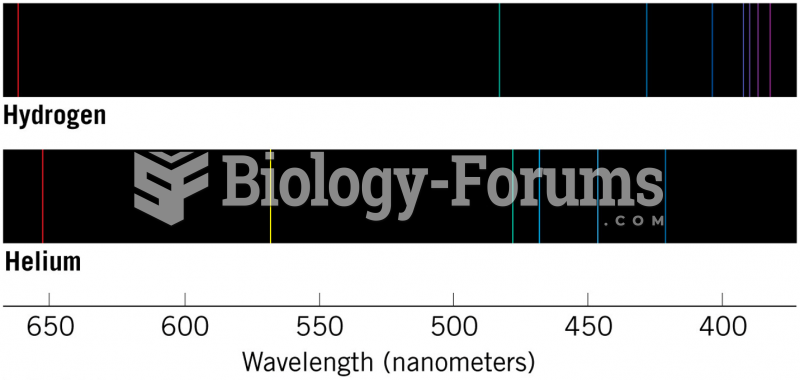 Bright-Line Spectra of Hydrogen and Helium
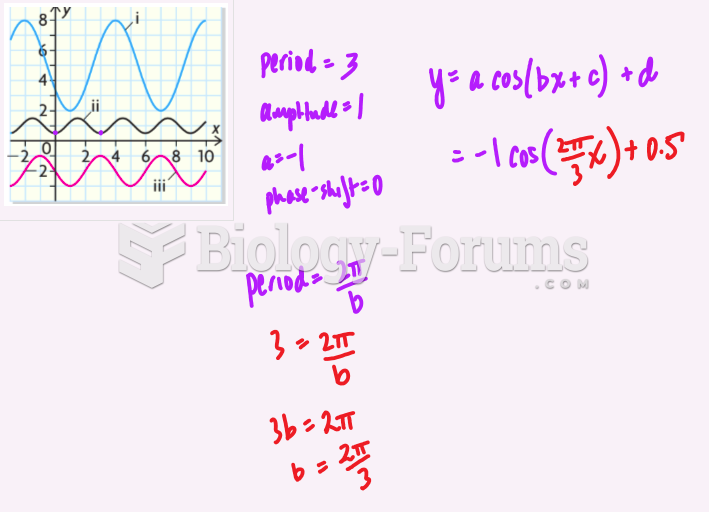 Graph to Function Cosine
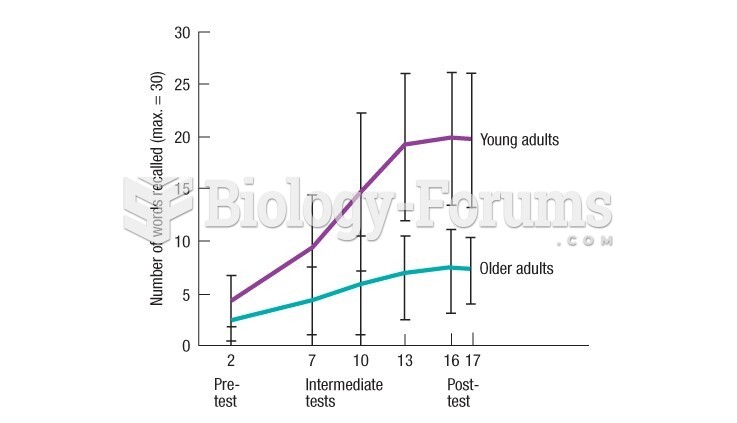 Results from Kliegl's study show that older adults can learn complex information-processing
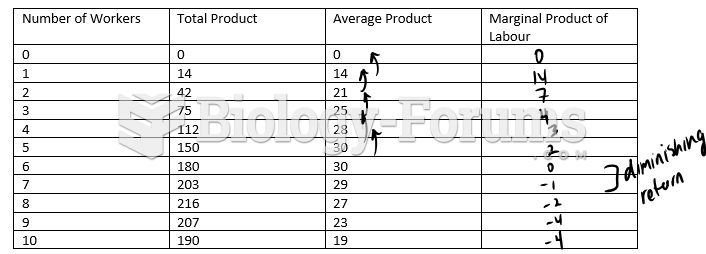 Complete the following production chart and plot the points.
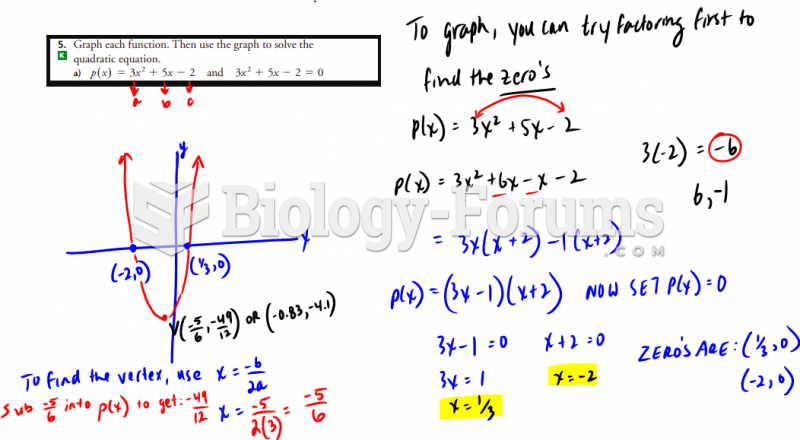 Graph this quadratic funcPLtion