This topic contains a solution. Click here to go to the answer
|
|
|

 Changes in Earth's atmospheric carbon dioxide levels over geological time.
 X-ray showing typical joint changes associated with osteoarthritis.
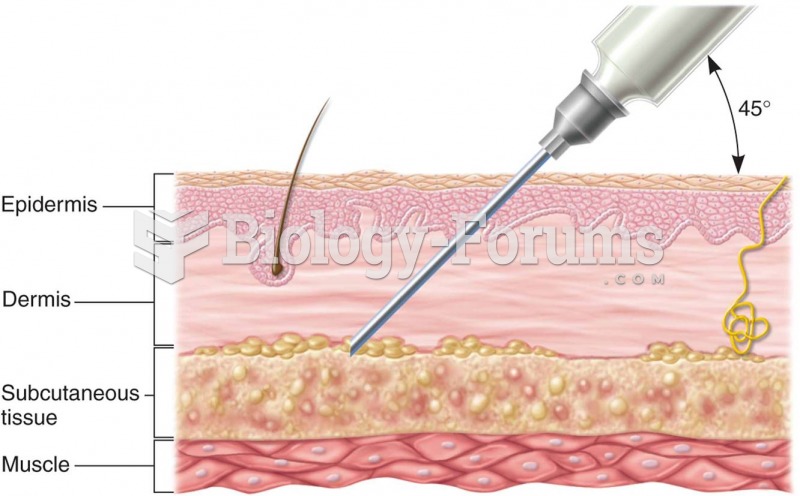 Subcutaneous drug administration: (a) cross section of skin showing depth of needle insertion;
 The upper intake manifold, often called a plenum, attaches to the lower intake manifold.
 A BLAST alignment between human myoglobin and human a-globin showing a 25% sequence identity
 Disitive Time For Nuts