This topic contains a solution. Click here to go to the answer
|
|
|

 Hartmann's mountain zebra resting, showing its characteristic essentially unbarred belly
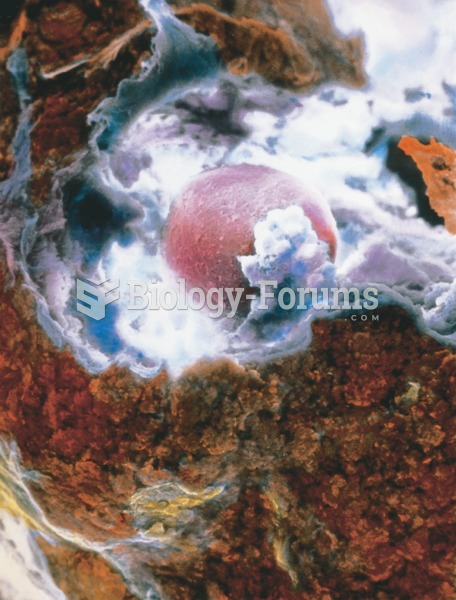 scanning electron micrograph showing an ovum (pink) released by the ovary at ovulation surrounded by
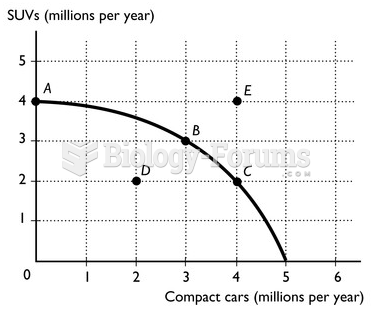 graph
graph
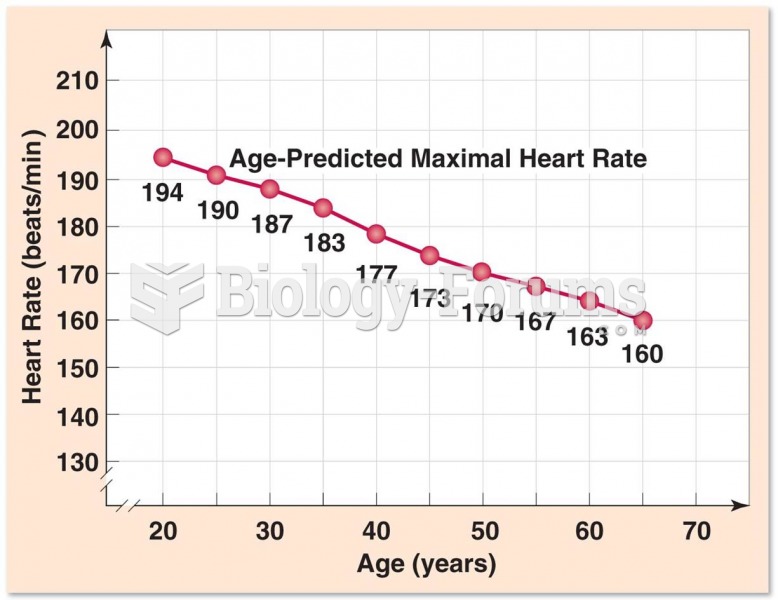 Maximal Heart Rate Over Time
 Trends in Air Quality
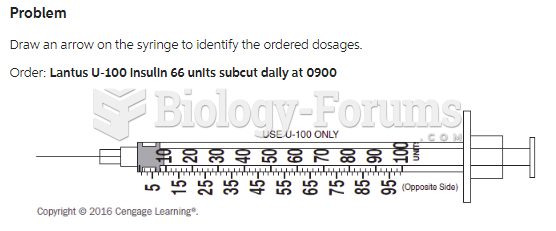 Directions: Fill in the correct number or word(s). Order: Lantus U-100 insulin 68 units subcut ...