|
|
|

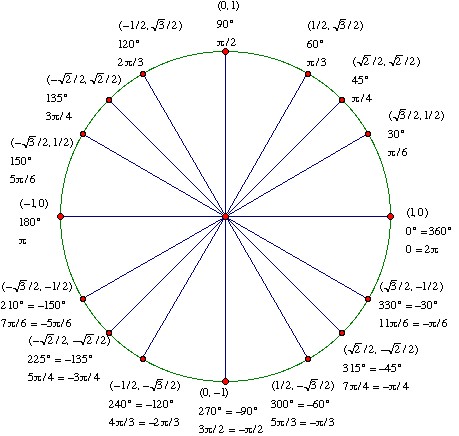 Trig Degrees/Radians unit circle
 Blocked at every turn by congressional Republicans who hated him, President Obama turned to techniqu
 Semi-circle bridge
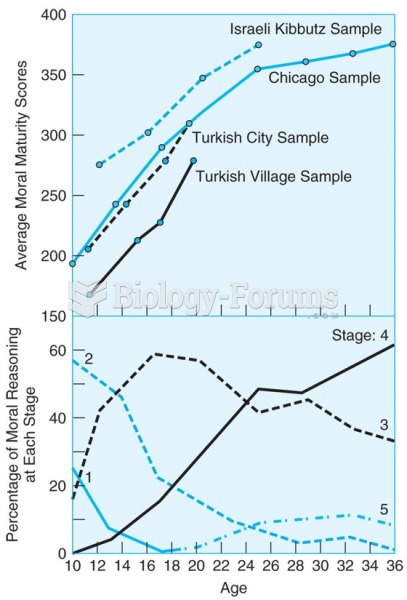 The upper panel shows that scores of four diverse samples of boys on a moral reasoning test show a ...
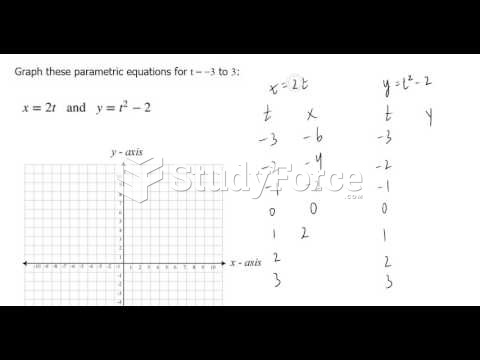 How to Graph Parametric Equations Manually