This topic contains a solution. Click here to go to the answer
|
|
|

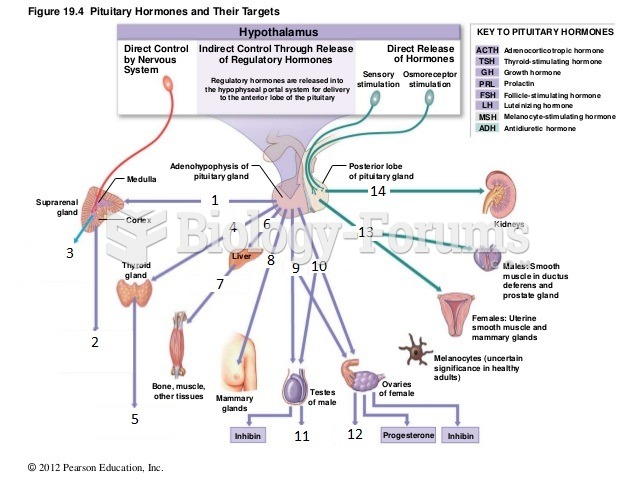 figure 18-1 pituitary hormones
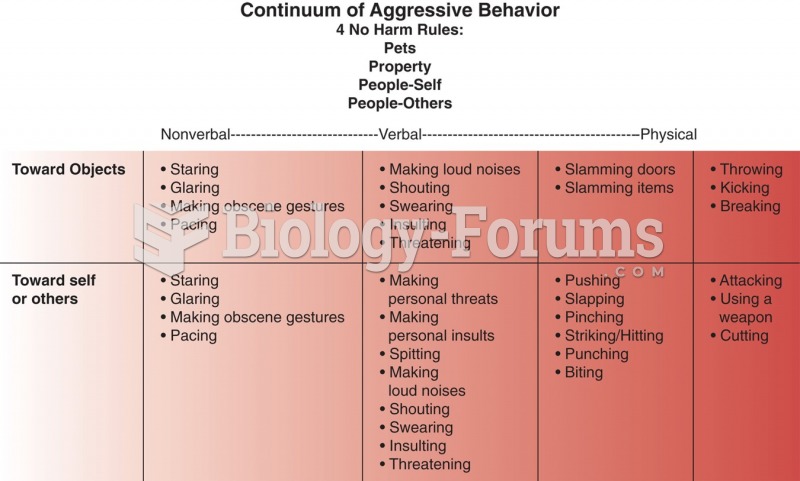 Continuum of aggression. Based on an unpublished figure by Joanne DeSanto Iennaco.
 How to find the equation of a line that is perpendicular to a line passing through a point
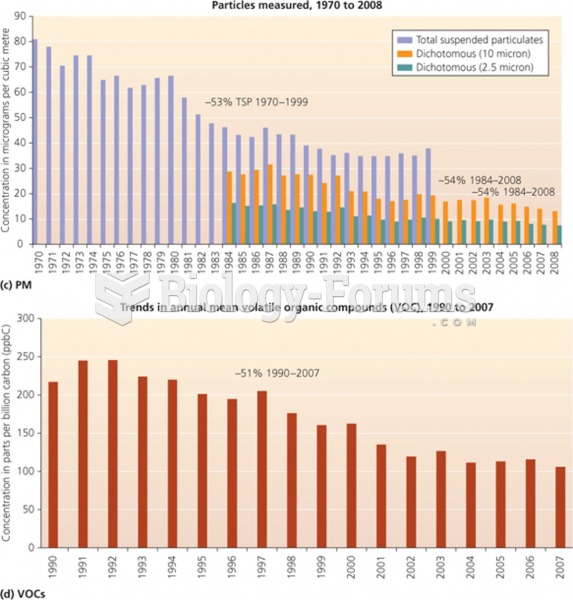 Particles measured, 1970 - 2008 and Trend in Organic Compound 1990 - 2007
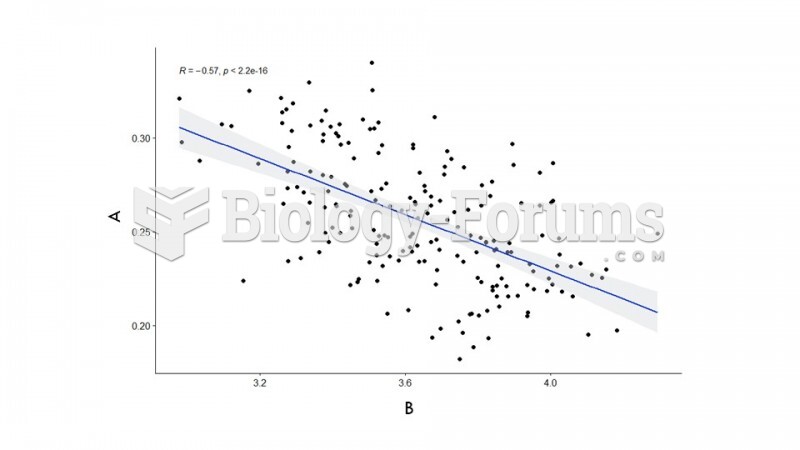 graph
graph
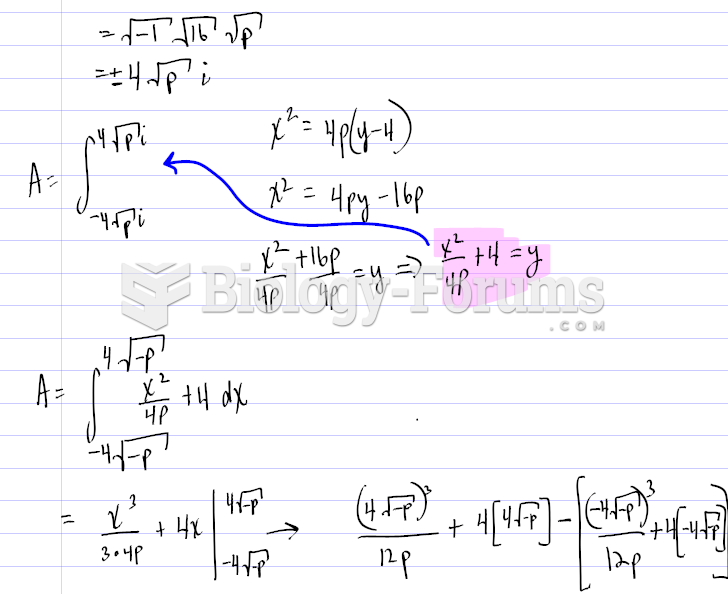 Finding the graph of a Parabola using certain values