This topic contains a solution. Click here to go to the answer
|
|
|

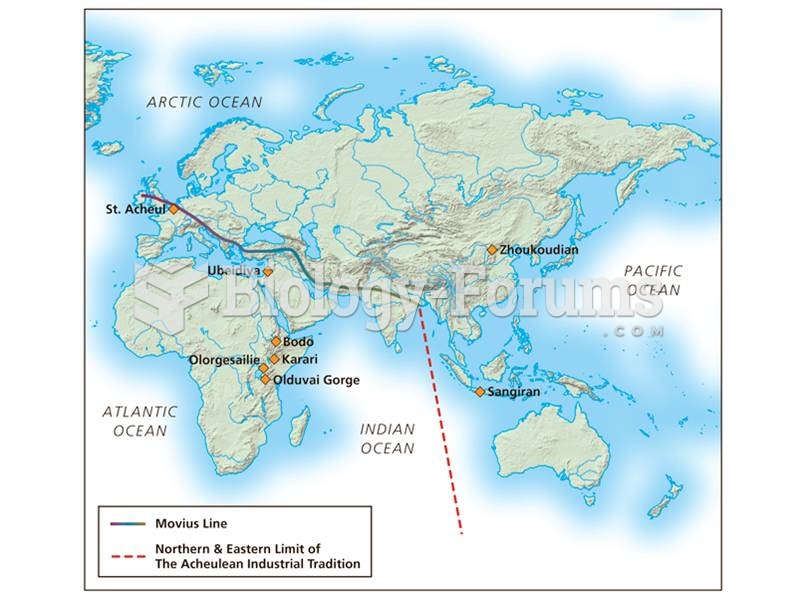 The Movius line separates regions of the world where Acheulean hand axes were made from regions wher
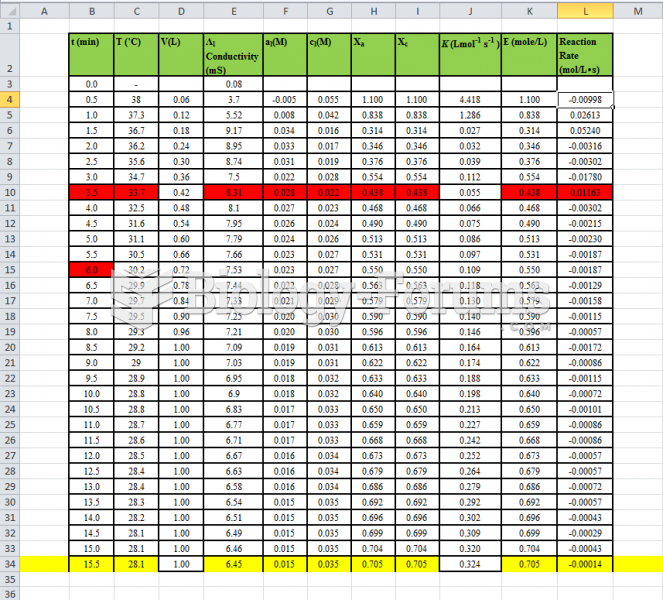 Fluidization - Data Table of experiment
 How to graph complex numbers
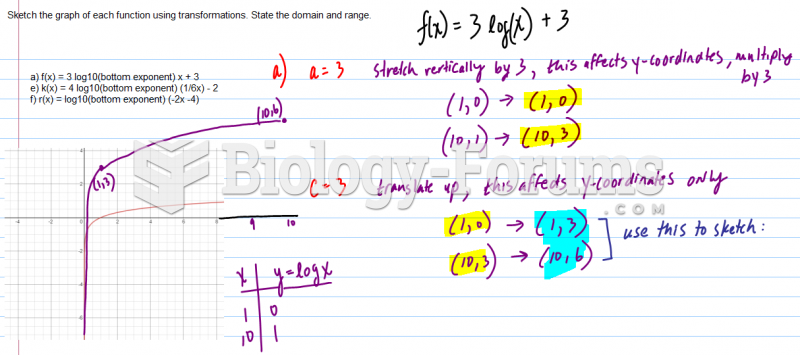 Sketch the graph of each function using transformations. State the domain and range.
 Raman has a line of credit loan with the ICICI bank. The initial loan balance was $72000.00. ...
 Regions of the world where malaria is endemic are shown