When plotting correlational data, the appropriate graph to use is the
a. line graph. c. histogram.
b. bar graph. d. scatterplot.
Question 2
We should do a scatterplot of the data when we compute a correlation because the scatterplot allows us to
a. see the relationship between the two variables.
b. determine the exact value of the correlation coefficient.
c. determine whether a relationship is likely to exist in the population from which the sample is taken.
d. predict accurate Y scores for known X scores.

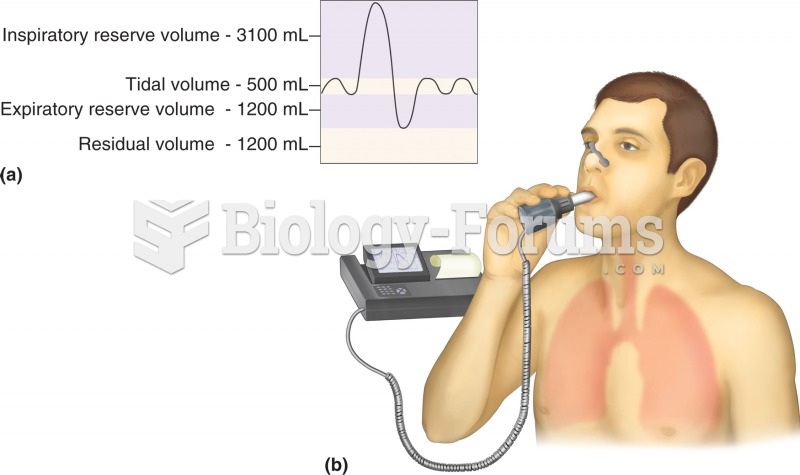 Pulmonary function test: spirometry. (a) Normal respiratory volumes, as measured during spirometry.
 OraQuick. A negative result would show a red line at the "C" mark, whereas a positive ...
 Tai chi stance with front foot pointing straight ahead and back foot at 45° angle, heels in line, ...
 (A) Pinch along jaw line from midline to lateral aspect. (B) Press St-6 at masseter attachment.
 How to calculate the mean for grouped data
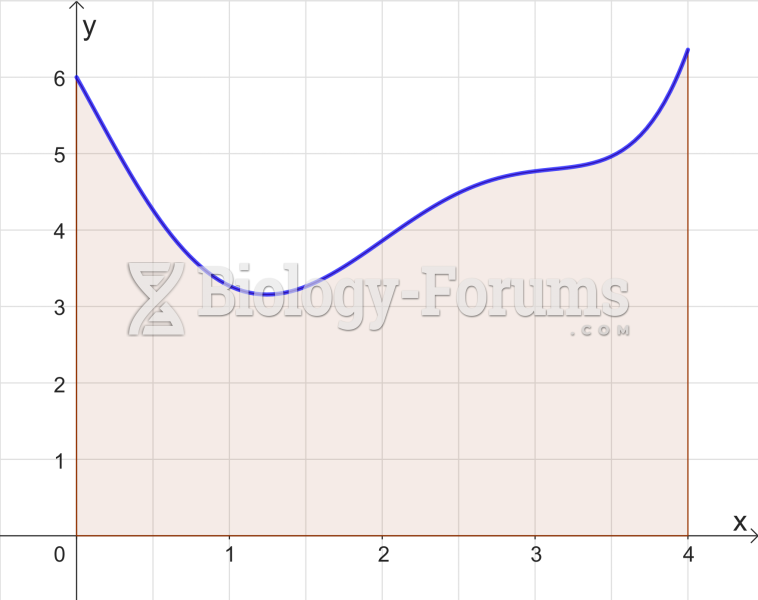 Trapezoidal Rule Graph