When plotting correlational data, the appropriate graph to use is the
a. line graph. c. histogram.
b. bar graph. d. scatterplot.
Question 2
We should do a scatterplot of the data when we compute a correlation because the scatterplot allows us to
a. see the relationship between the two variables.
b. determine the exact value of the correlation coefficient.
c. determine whether a relationship is likely to exist in the population from which the sample is taken.
d. predict accurate Y scores for known X scores.

 First Line of Defence
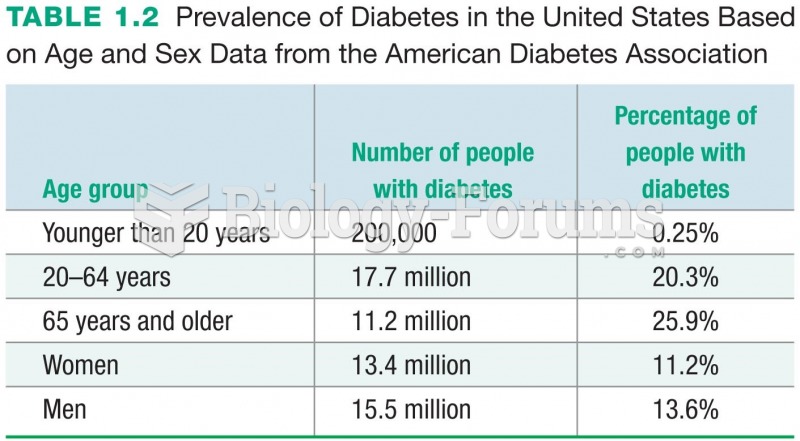 Prevalence of Diabetes in the United States Based on Age and Sex Data from the American Diabetes ...
 How to find the equation of a line that is perpendicular to a line passing through a point
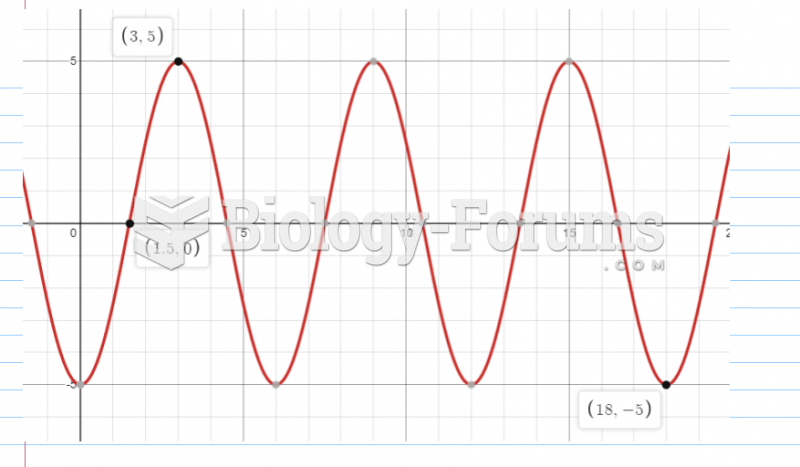
 Graph the function by hand & label key points on graph:
 Sketch a graph of the function h(x), by hand on the following interval:
 Excel hardware is introducing a new product on a new product line of capacity 800 units per ...