This topic contains a solution. Click here to go to the answer
|
|
|

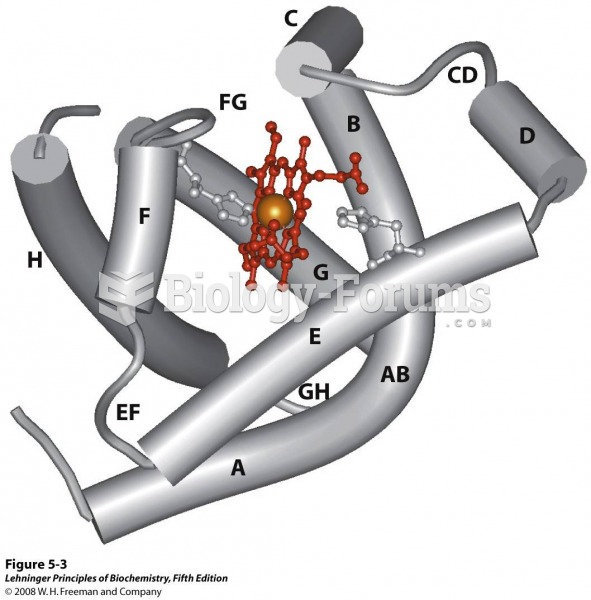 The eight α-helical segments (shown here as cylinders) are labeled A through H
 A typical two-line cleaning machine hookup, showing an extension hose that can be used to squirt a ...
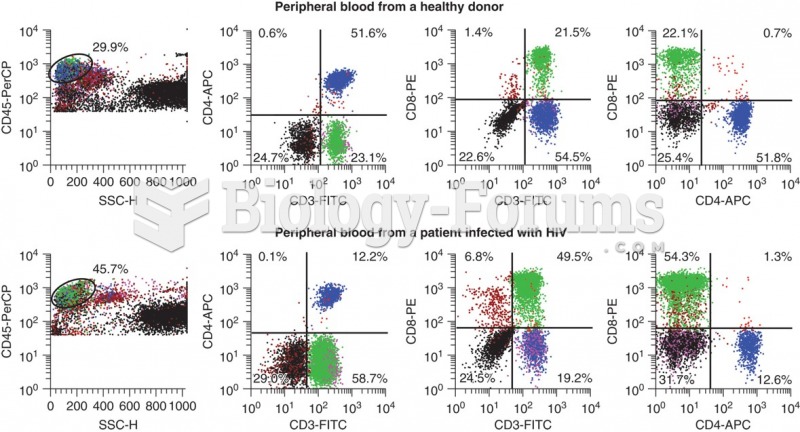 Flow cytometry data that shows the differences in CD3+ CD4+ cells that occur with HIV infection. ...
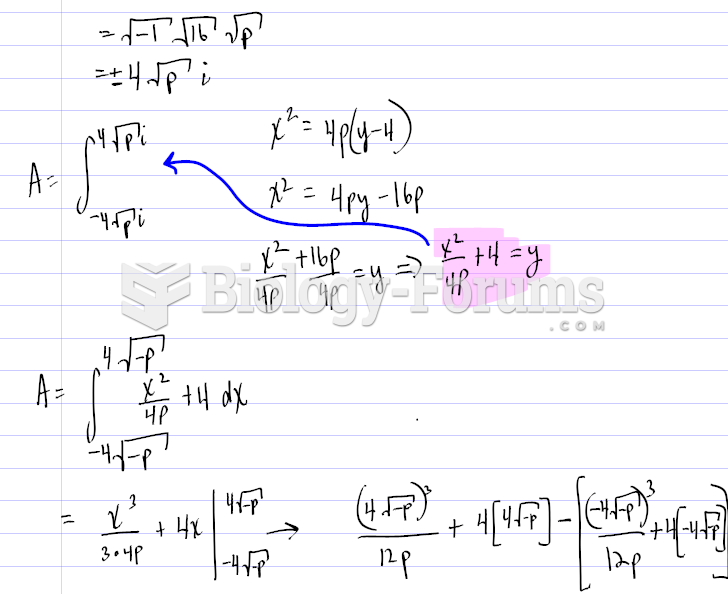 Finding the graph of a Parabola using certain values
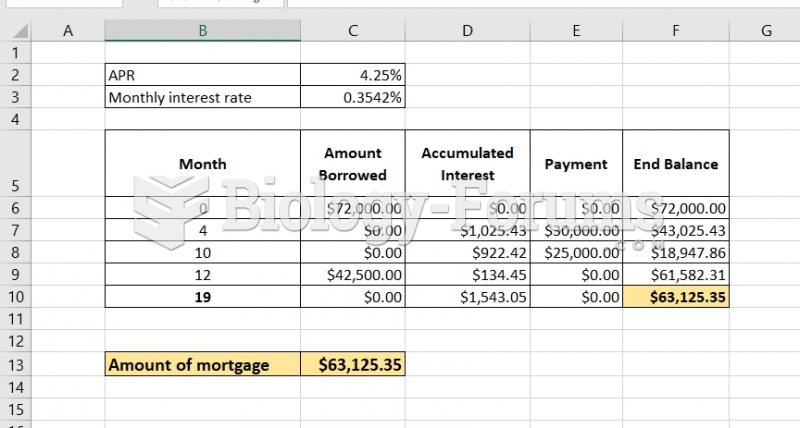 Raman has a line of credit loan with the ICICI bank. The initial loan balance was $72000.00. ...
 Sturtevant’s Recombination Data for Five X-Linked Genes in Drosophila