|
|
|

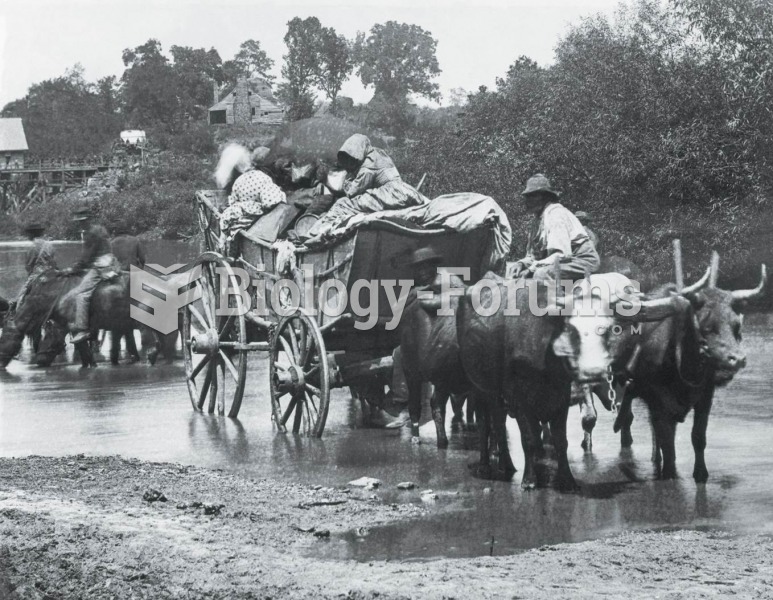 When Union troops pushed toward Richmond in June of 1862, these slaves crossed the Rappahannock Rive
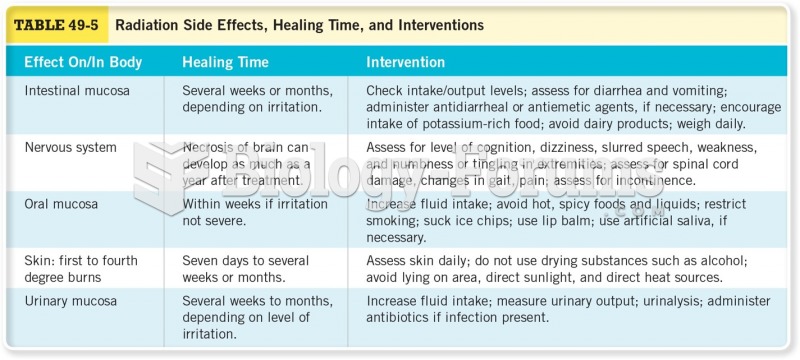 Radiation Side Effects, Healing Time, and Intervention
 Time course of HIV infection.
 You're just on Time
 Surtsey, a volcanic island, during the time of its formation.
 Time-of-entry mapping