|
|
|

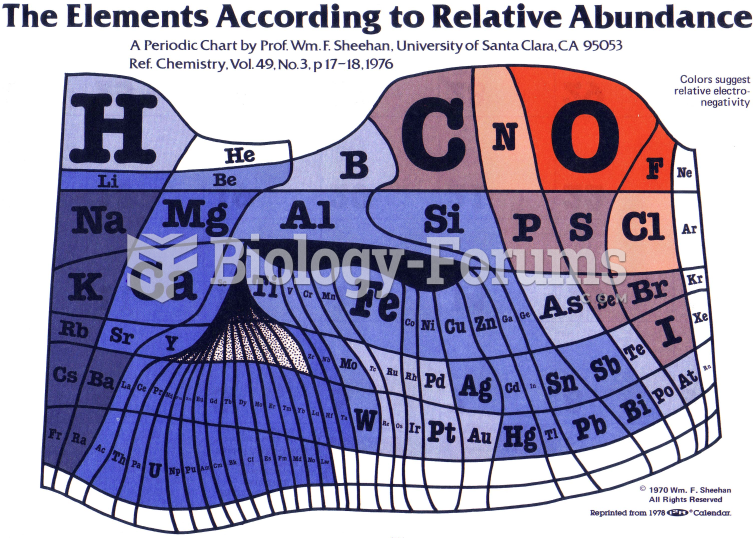 Periodic Table
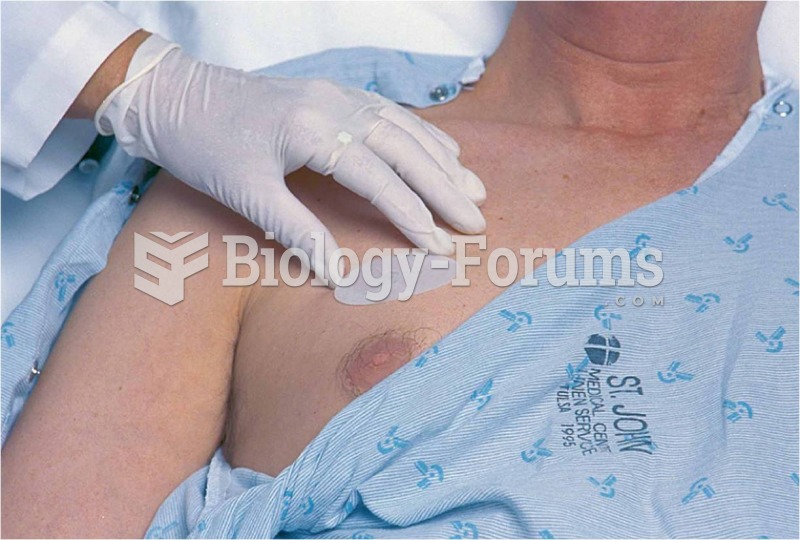 Transdermal patch administration: (b) patch immediately applied to clean, dry, hairless skin and lab
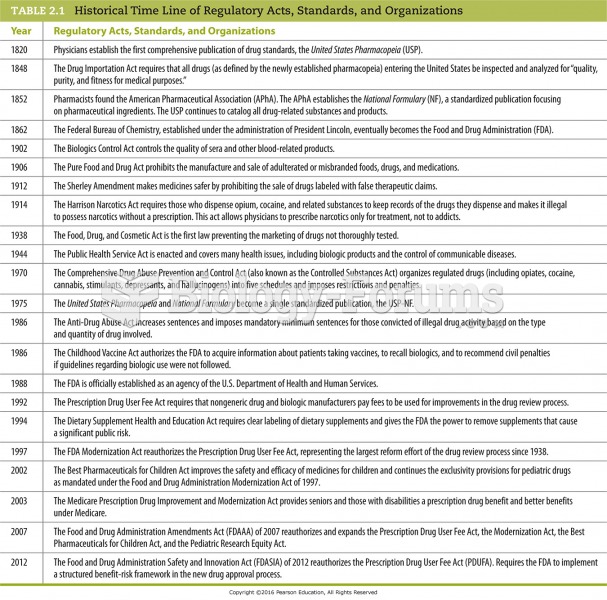 Historical Time Line of Regulatory Acts, Standards, and Organizations
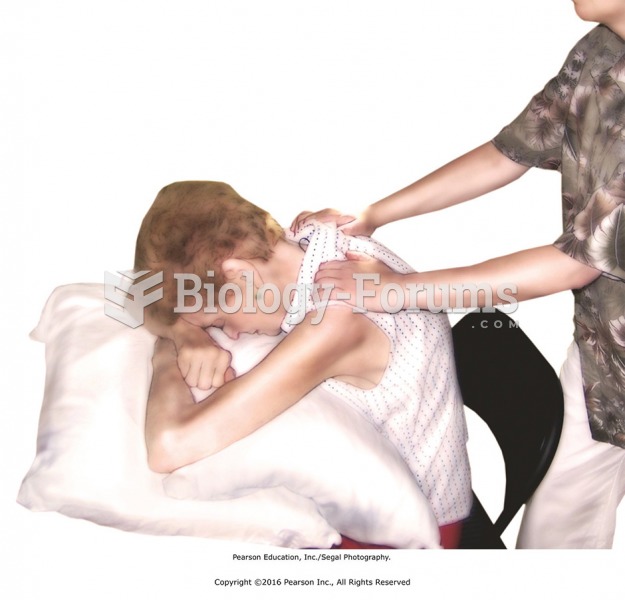 Leaning against a table with a pillow for support.
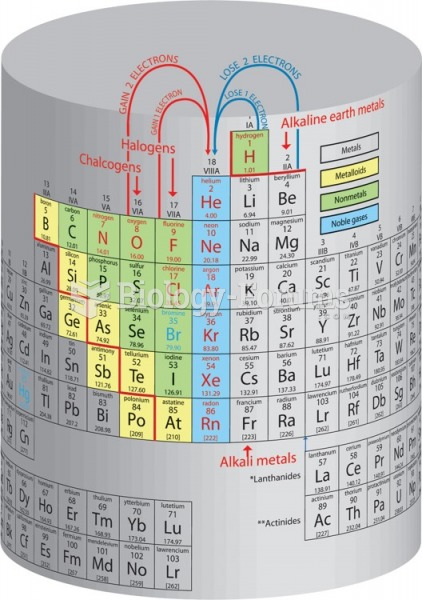 The periodic cylinder of the elements. When the periodic table is folded in such a way that the ...
 Rockin' In Time, 9th Edition