|
|
|

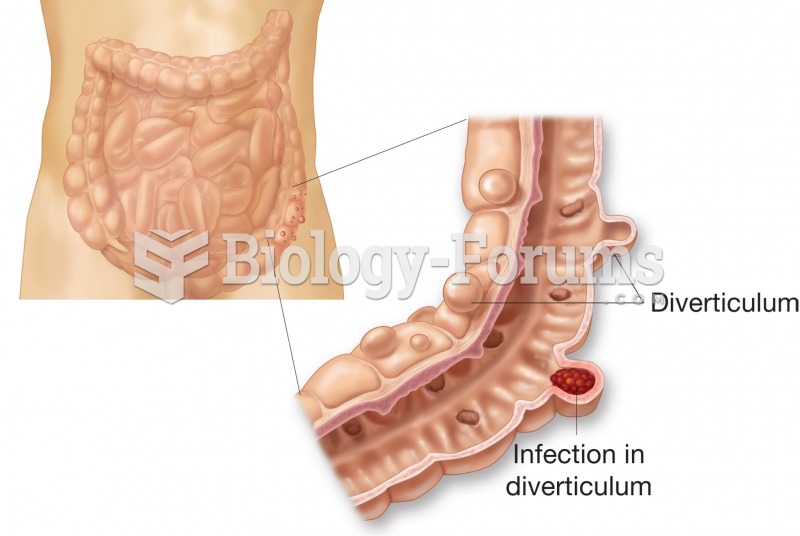 Diverticulosis. Figure illustrates external and internal appearance of diverticula.
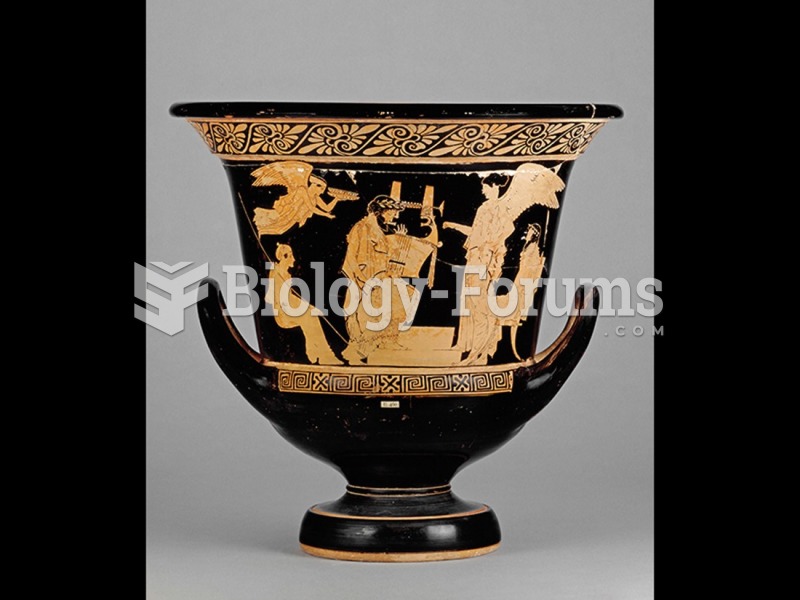 Attributed to the Manner of Peleus Painter, Red-figure calyx-krater.
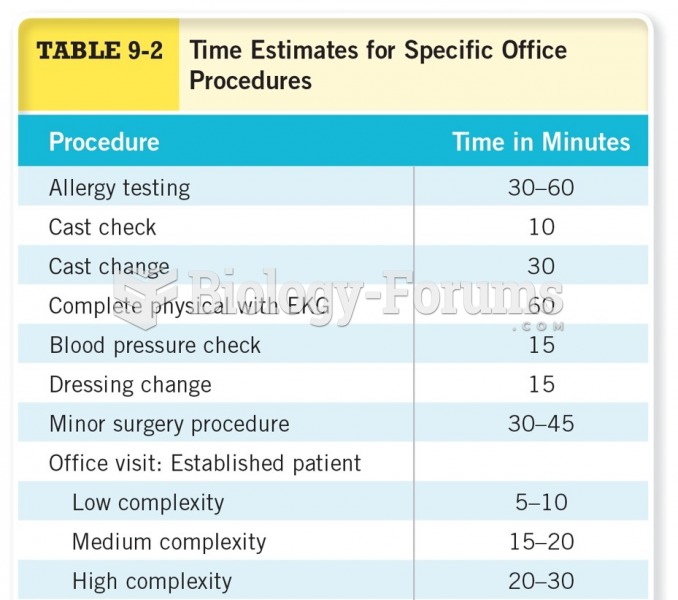 Time Estimates for Specific Office Procedures
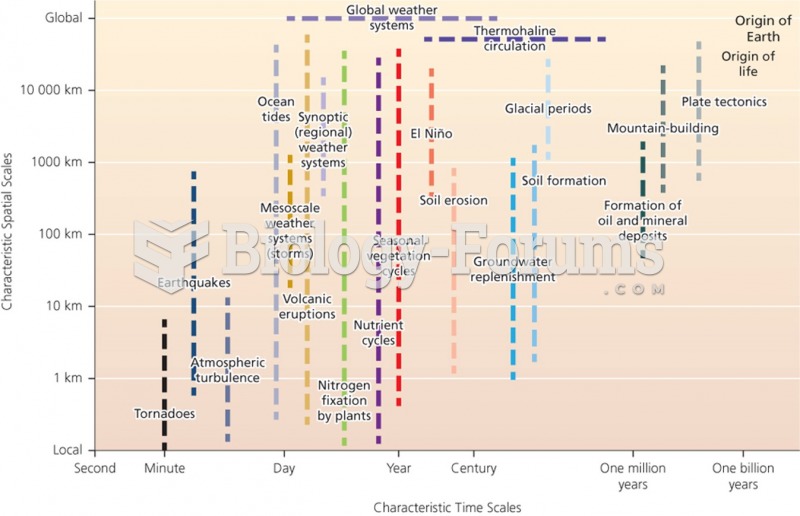 Environmental Systems in Space and Time
 Disitive Time For Fish
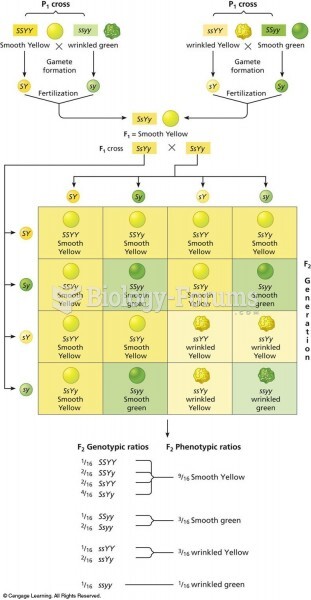 Punnett square of the dihybrid cross shown in Figure 3.8. There are two combinations of dominant and