This topic contains a solution. Click here to go to the answer
|
|
|

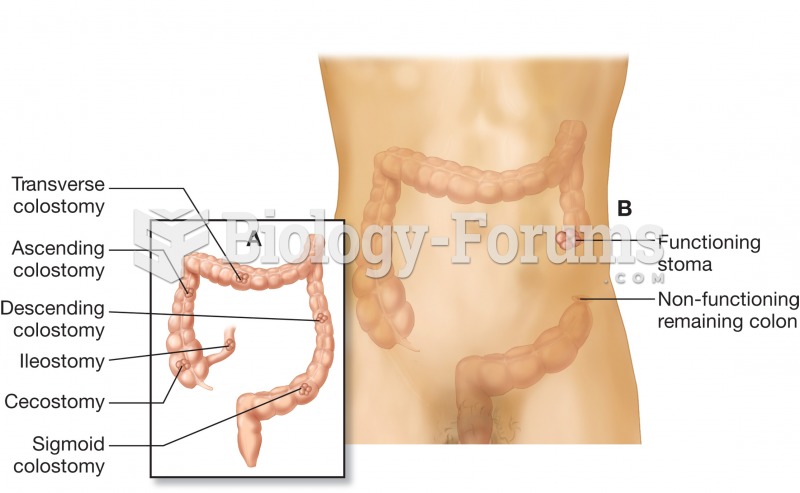 (A) The colon illustrating various ostomy sites; (B) colostomy in the descending colon, illustrating
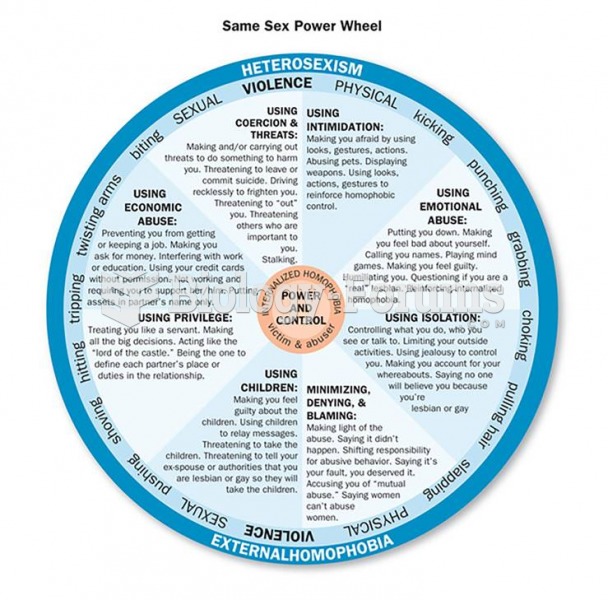 The Power and Control Wheels of Abusive Relationships When one person in a relationship repeatedly ...
 Middle adults usually have more time to focus attention on their relationships
 Cross-Cutting Relationships
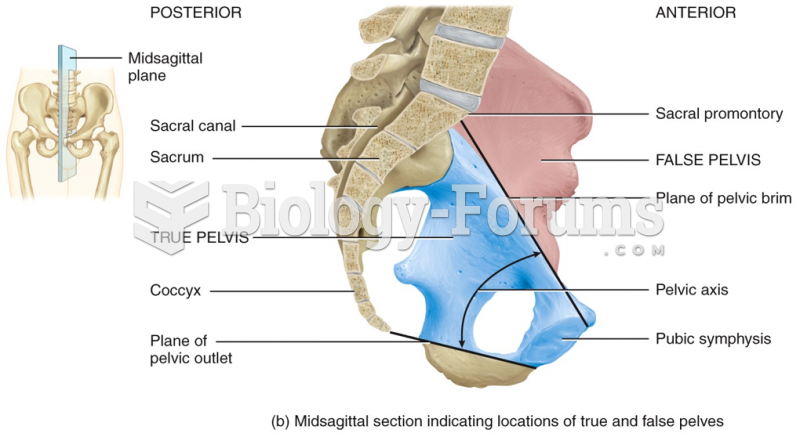 Midsagittal section indicating locations of true and false pelves
 Flowchart illustrating how genetic information encoded in DNA produces protein