This topic contains a solution. Click here to go to the answer
|
|
|

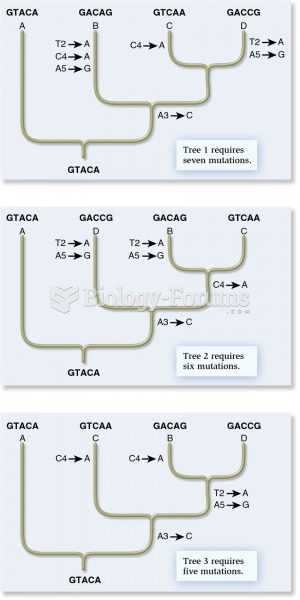 The cladistic approach from molecular genetic data
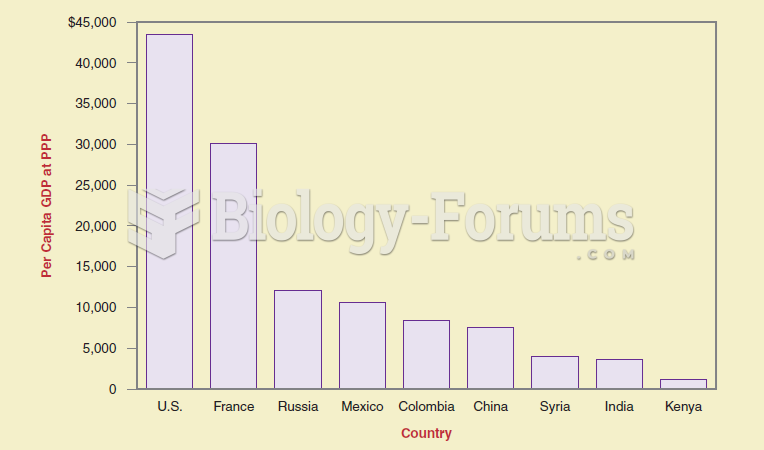 If you want to show differences between items at the same time, a bar graph is more effective than a
 Carrie Mae Weems, A Negroid Type, from the series From Here I Saw What Happened and I Cried.
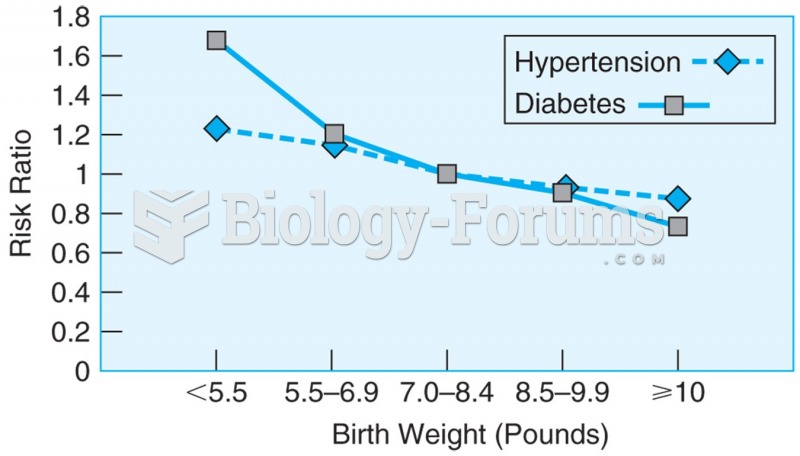 Data from more than 22,000 men over the age of 40, showing the relationship between birth weight and ...
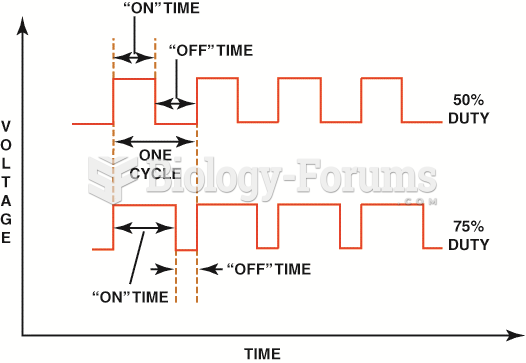 Both the top and bottom pattern have the same frequency. However, the amount of on-time varies.
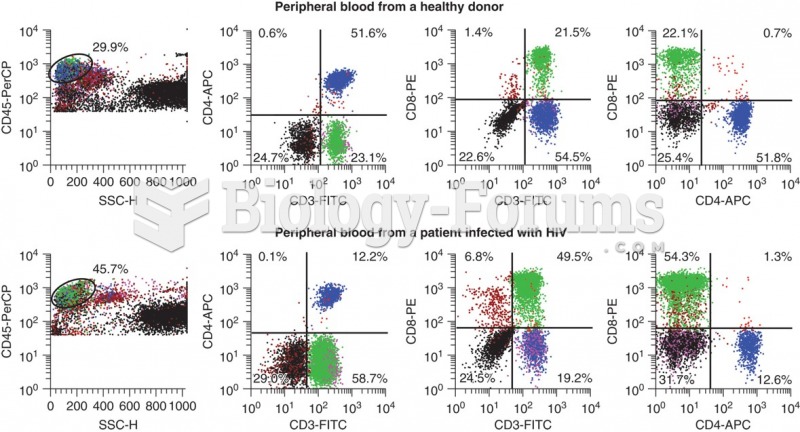 Flow cytometry data that shows the differences in CD3+ CD4+ cells that occur with HIV infection. ...