|
|
|

 Pocket gophers and ecosystem structure (data from Huntly and Inouye 1988).
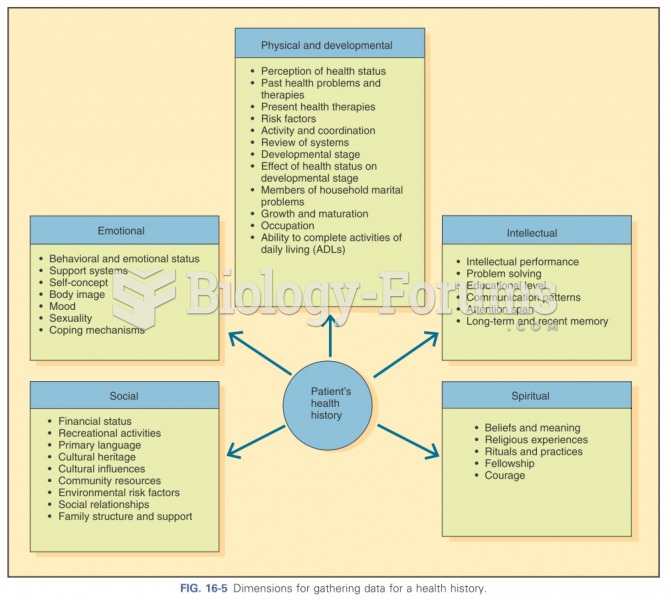 Dimensions for gathering data
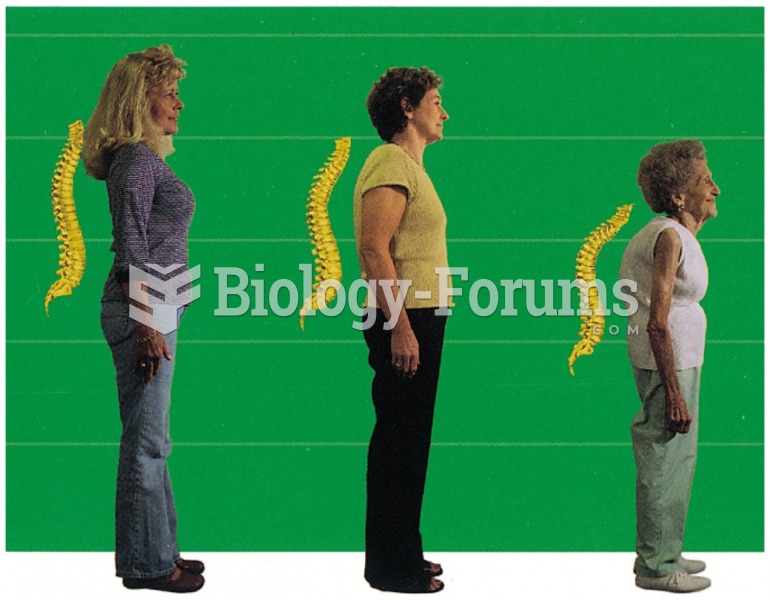 Weak bones cause the spine to collapse over time
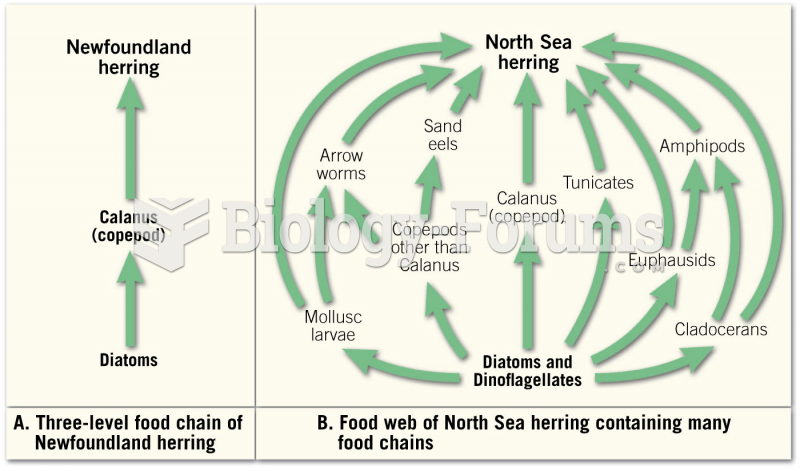 Comparing a Food Chain and a Food Web
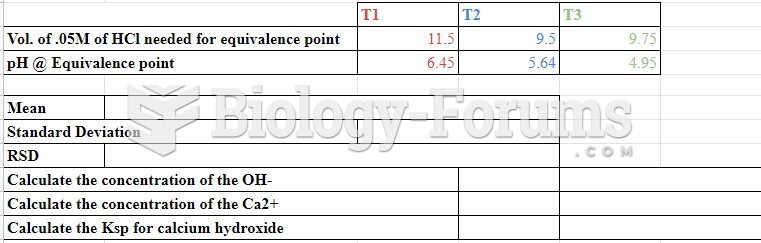 data
data
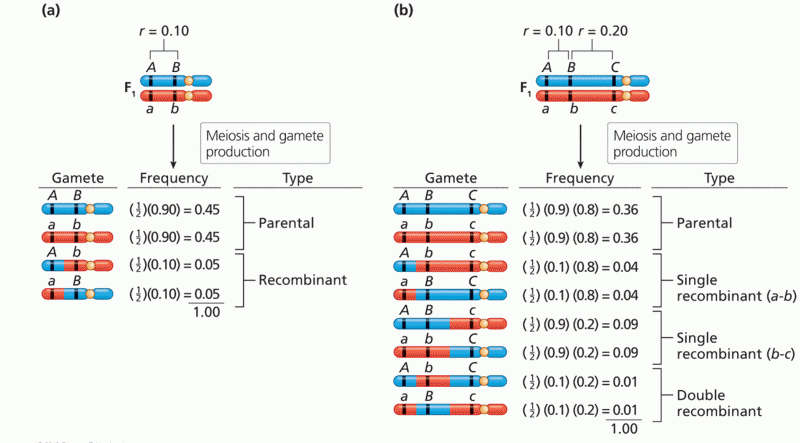 Gamete genotype frequencies calculated from genetic linkage data