This topic contains a solution. Click here to go to the answer
|
|
|

 Elizabeth Murray, Just in Time.
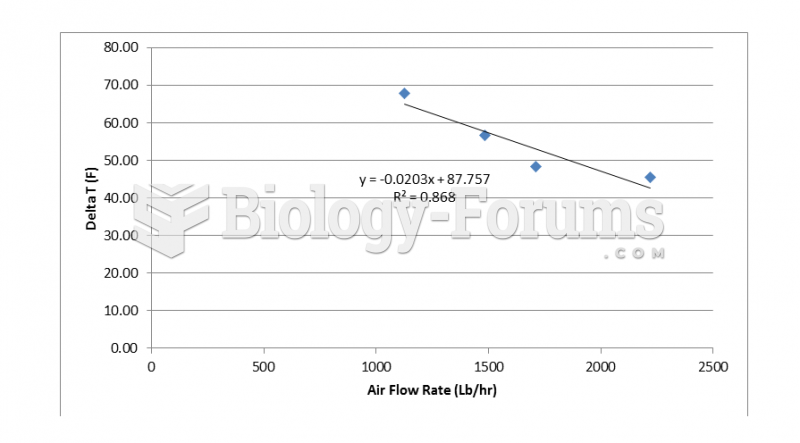 Change in air temperature at various air flow rates for a 7 pass operation
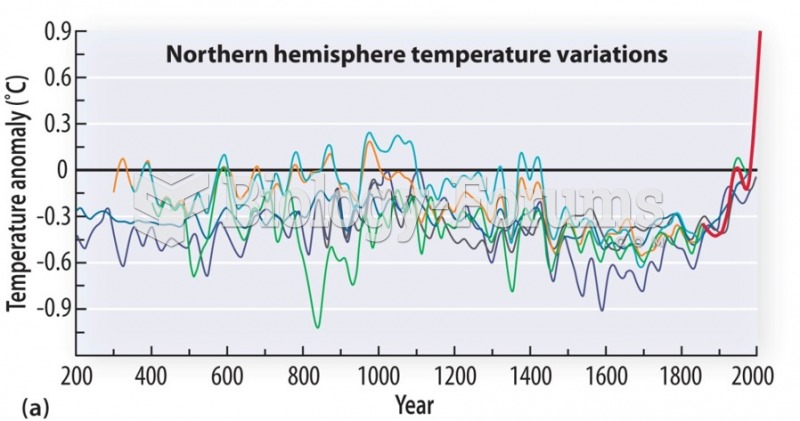 Recent Climate Change
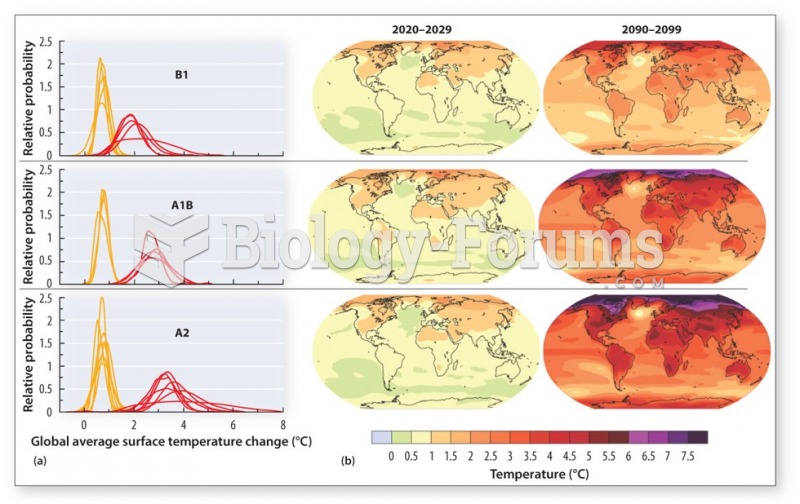 The Global Impact of Climate Change
 The time at which the mailman delivers the mail to Ace Bike Shop follows a normal distribution ...
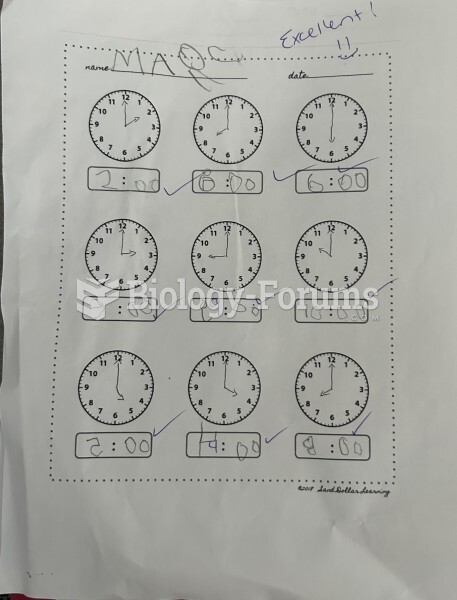 Time homework