|
|
|

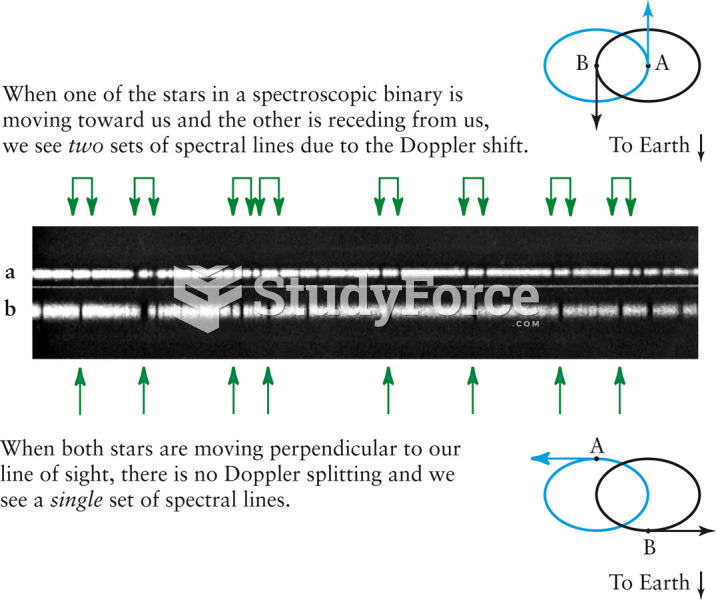 A Double-Line Spectroscopic Binary
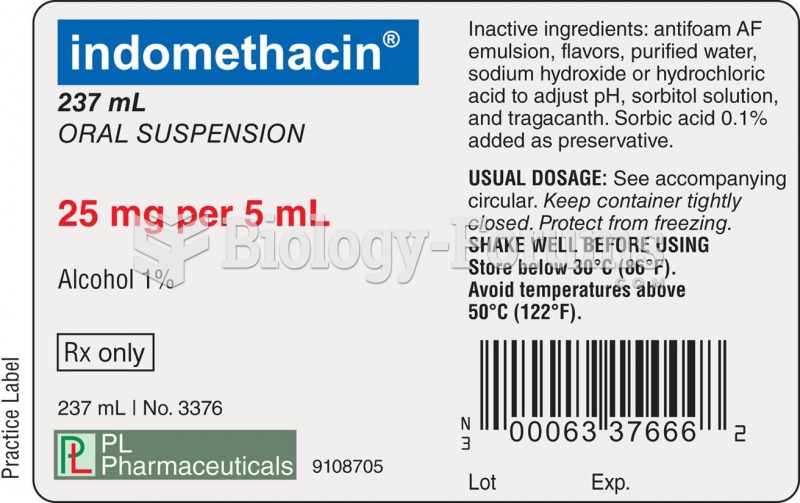 Some drug labels show the USP symbol; others do not.
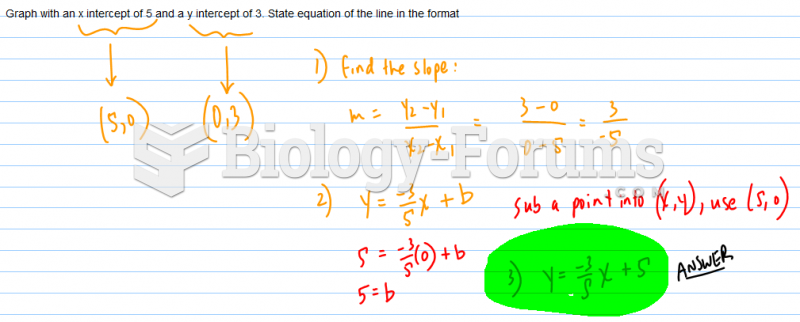 Finding the equation of a line
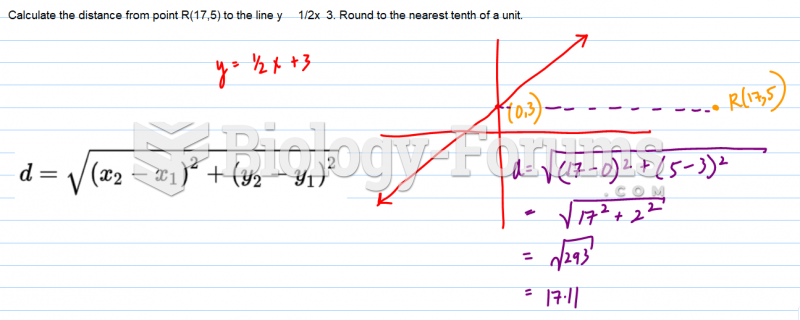 Calculate the distance from point R(17,5) to the line ... Round to the nearest tenth of a
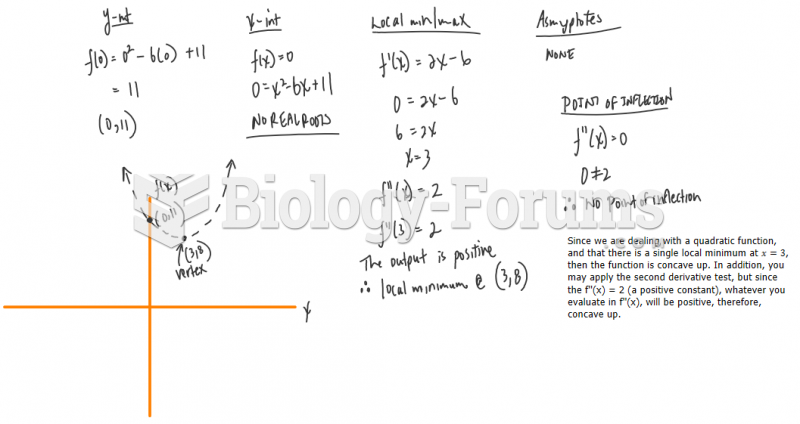 Sketch the graph of the following functions using local maximum/minimums, interc
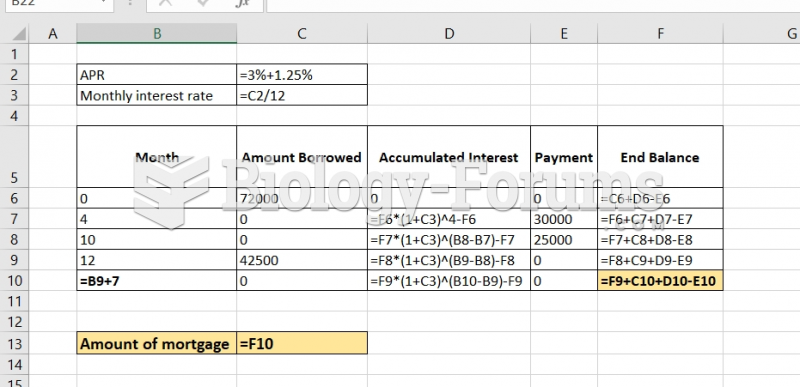 Raman has a line of credit loan with the ICICI bank. The initial loan balance was $72000.00. ...