|
|
|

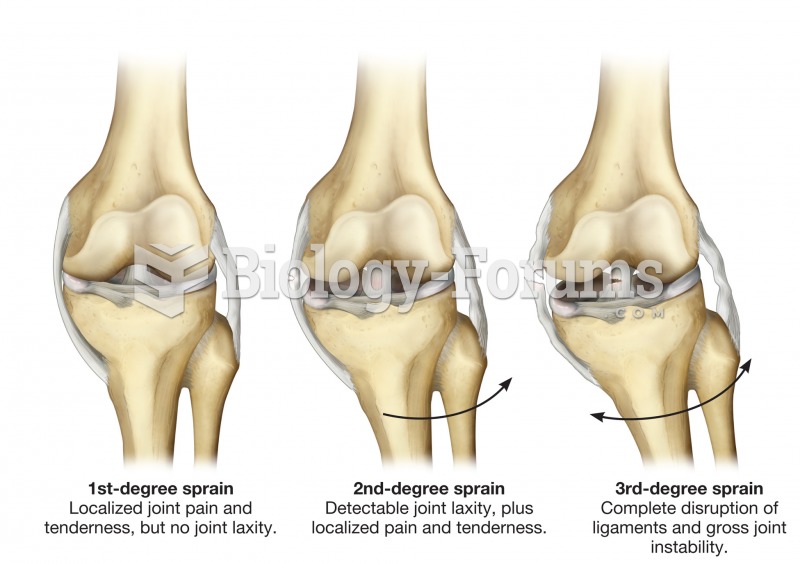 Sprain. A sprain involves damage to one or more ligaments, and is categorized into three degrees of
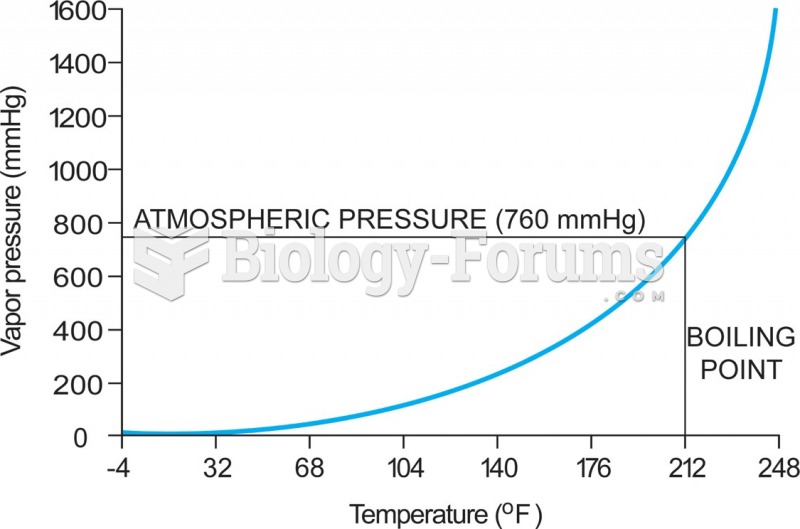 5-4 The relationship between vapor pressure and temperature—in this case for water. As the ...
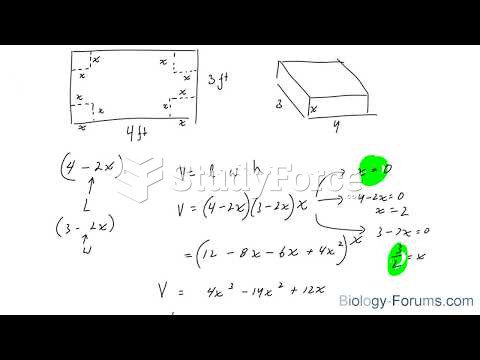 How to solve optimization problems in calculus (Part 6)
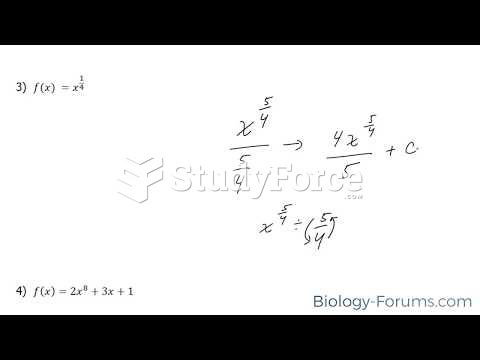 How to find the anti-derivative of a function (Part 1)
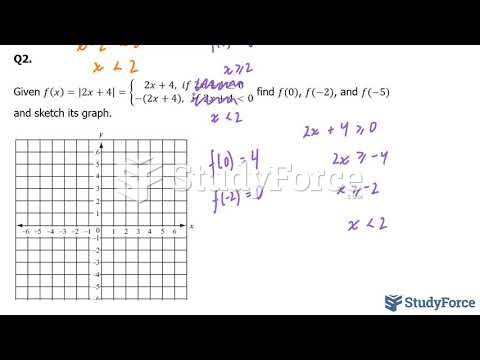 How to evaluate and sketch a piecewise function containing absolutes (Part 2)
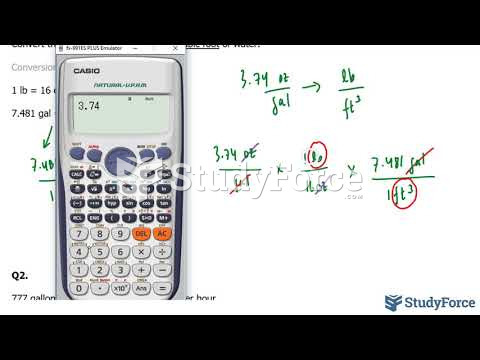 How to convert units of any rate to another (Part 2)