|
|
|

 Young adults usually grieve loss of a role, such as employment or the breakup of a relationship.
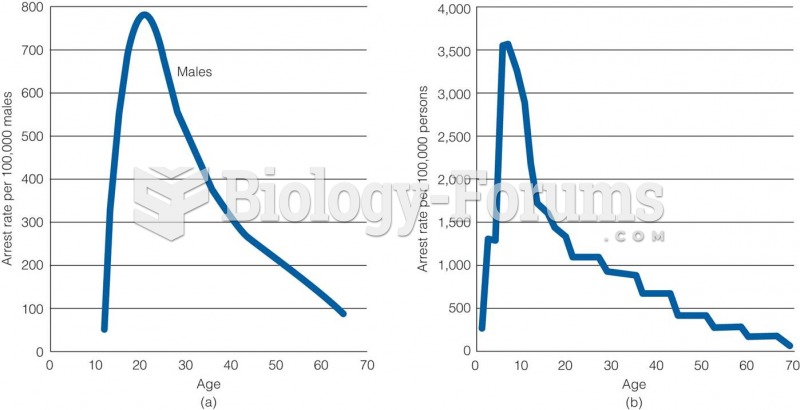 Age-Crime Relationship in (a) 1842 and (b) 1992
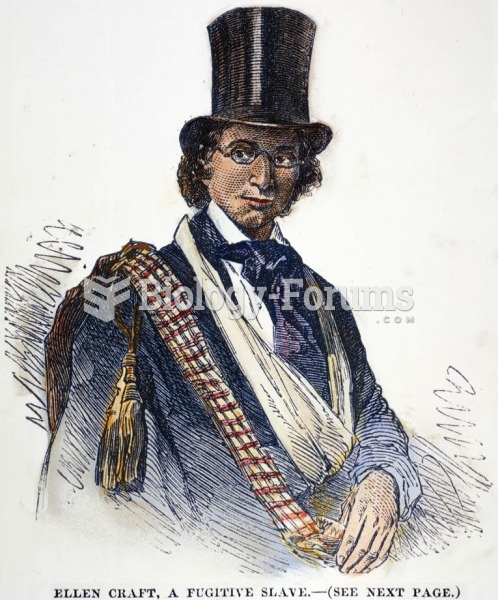 These illustrations show Ellen Craft, a slave with and without a disguise. She dressed “as a disting
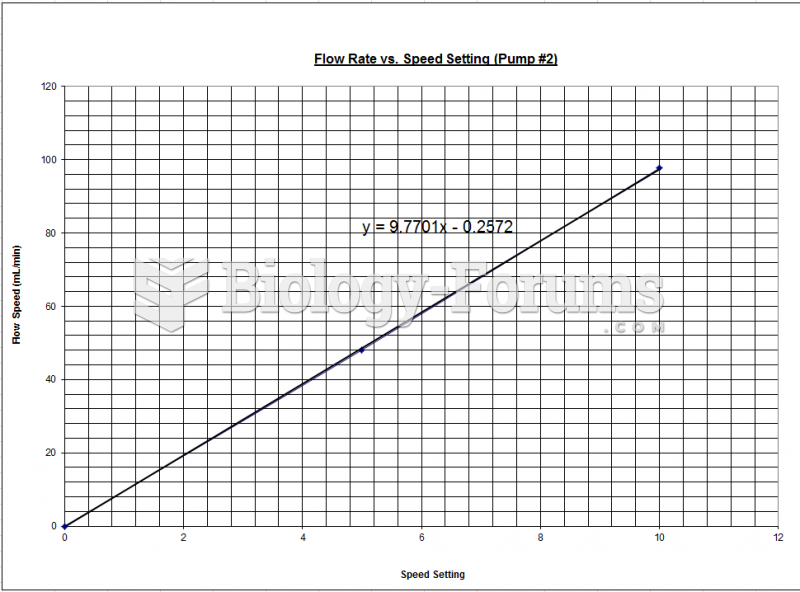 Fluidization - Chart Pump #2
 Most elderly enjoy maintaining relationship with their grandkids
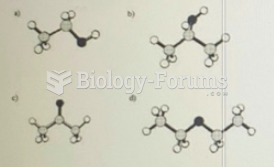 Ethanol has the molecular formula C2H6O. Which ball and stick model shown above represents ...