Answer to Question 1
The term graphics is used torefer to all types of illustrationsused in written and spoken reports. Imagine trying to put in composition style all the information available in a financial statement. Several hundred pages might be necessary to explain material that could otherwise be contained in three or four pages of balance sheets and income statements. Even then, the reader would no doubt be thoroughlyconfused To protect readers from being overwhelmed or simply bored with data, report writers can design visually appealing graphics that are appropriate for the data being presented. Data reported in a table, graph, or picture will make one's written analysis clearer to the reader.
Answer to Question 2
C

 Question
 question
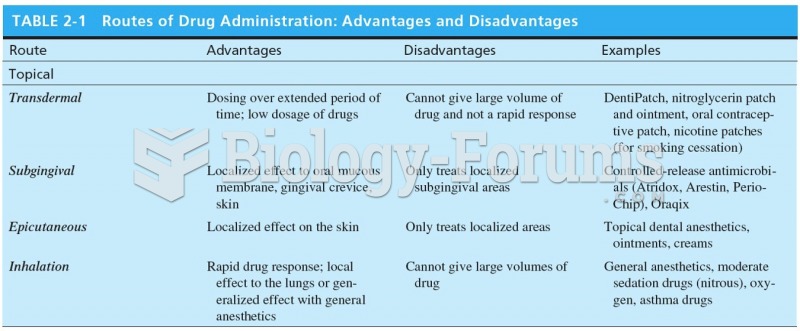 Routes of Drug Administration: Advantages and Disadvantages
 Molecular Genetics DNA picture matching question
 economic question
 economic question