|
|
|

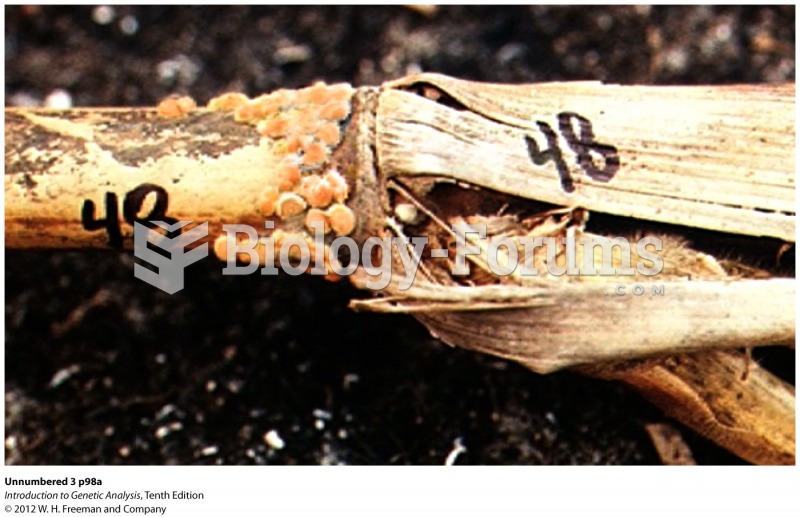 Model Organism Neurospora
 Affect.
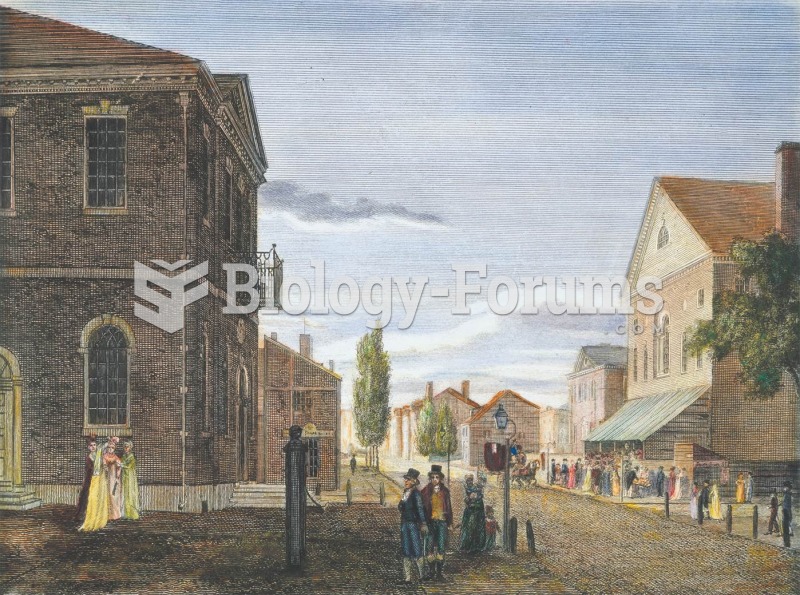 This engraving by William Russell Birch shows Congress Hall (left), which was occupied by Congress f
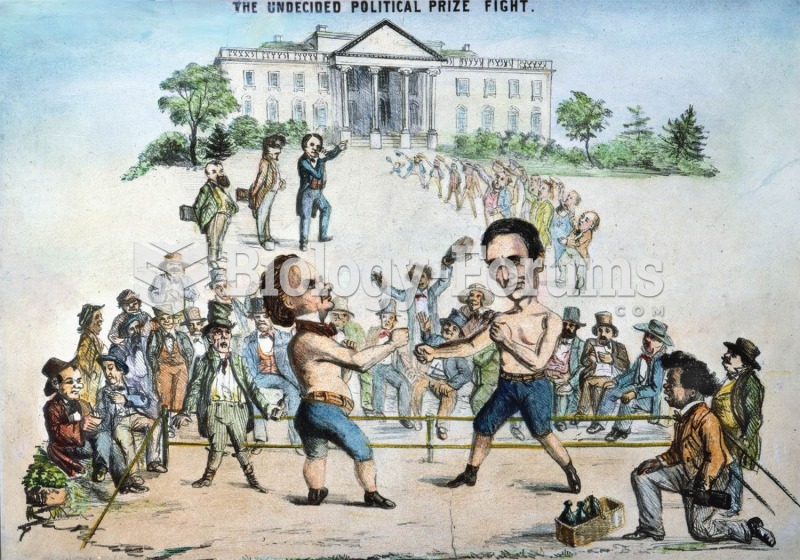 That politics was always a rough business is shown in this cartoon, which shows Lincoln, assisted by
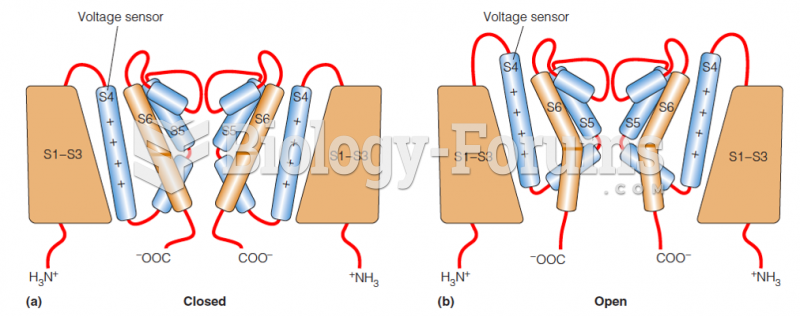 A model for voltage-gating in the channel
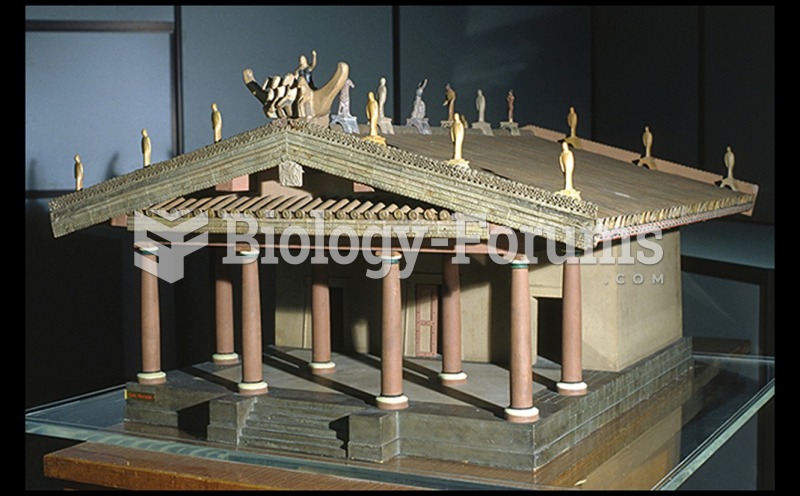 Model of an Etruscan Temple